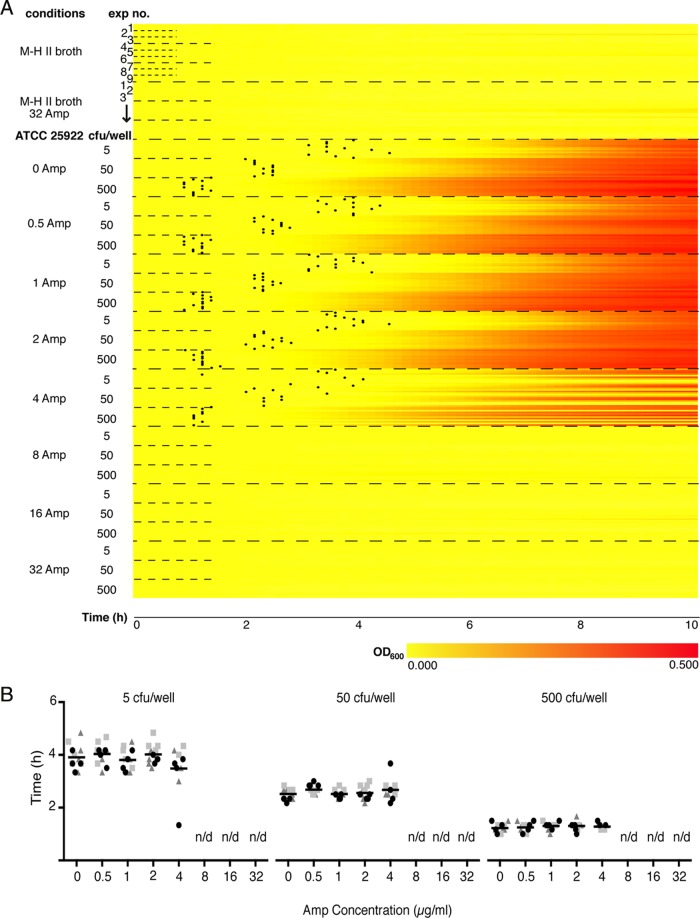
FIG 2.
Heatmap representation and Tlag determinations for MIC analysis. (A) Heatmap representation of OD600 recordings from ATCC 25922 in M-H II broth with 0 to 32 μg/ml of ampicillin (Amp) at different inoculum sizes (5, 50, and 500 CFU/well). The vertical axis indicates experimental conditions and inoculum sizes (5, 50, 500 CFU/well). “Exp no.” refers to the 3 experiments for each inoculum, each including 4 rows corresponding to OD600s recorded from wells 1 to 4 every 10 min over 10 h. Increased absorbance is depicted as a change from yellow to red along the horizontal axis. Black dots indicate Tlag in each culture positive for growth. (B) Dot plots showing Tlag calculated from the 4 wells per experiment at 0 to 32 μg/ml of Amp for 5 CFU/well (left), 50 CFU/well (middle), and 500 CFU/well (right). Shapes and colors of dots represent data collected from wells derived from the same experiment. The grand mean for each condition is depicted as a black horizontal line.

