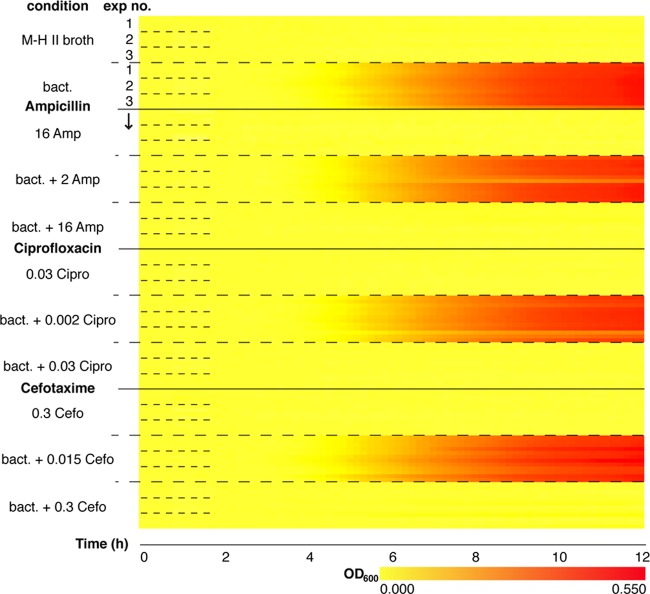
FIG 3.
Multiplex nanowell AST for MIC determination. Shown is a heatmap representation of growth curves (ATCC 25922) in the multiplex nanowell AST. The vertical axis indicates the 11 conditions tested. Positive (ATCC 25922 in M-H II broth) and negative (MH-II broth and M-H II broth plus antibiotics: 16 μg/ml of ampicillin [Amp], 0.03 μg/ml of ciprofloxacin [Cipro], and 0.03 μg/ml of cefotaxime [Cefo]) controls were included. “Exp no.” refers to the 3 independent experiments, each including 4 rows corresponding to OD600s from wells 1 to 4 recorded every 5 min over 12 h. Increased absorbance is depicted as a change from yellow to red along the horizontal axis.

