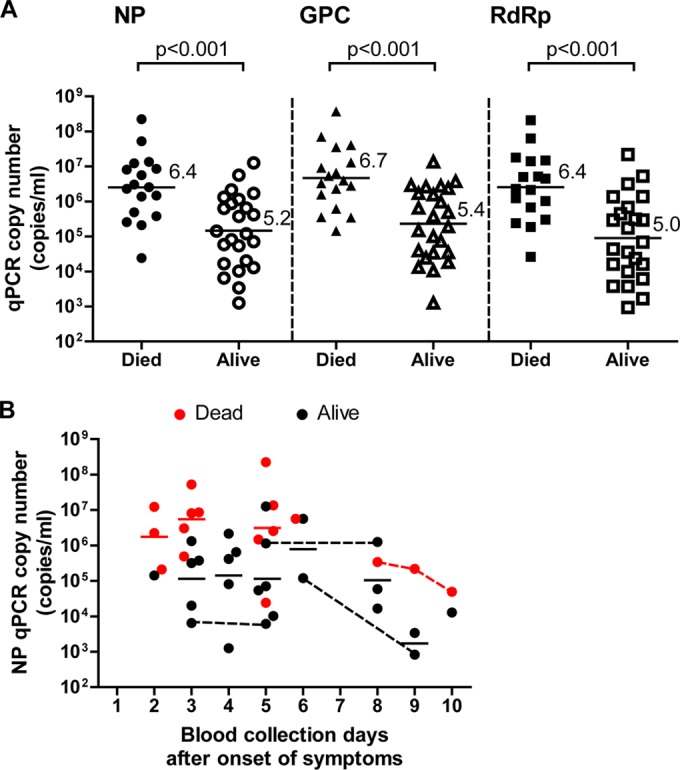
FIG 5.

Relationship between the viral RNA level in the SFTS patient blood samples and the patient survival outcomes. (A) Viral RNA copy numbers in the blood samples from SFTS patients are plotted as dots and arranged based on the patients' survival outcomes. The mean of each group is indicated by a horizontal bar and the value. One-way ANOVA with Bonferroni's multiple-comparison test was used to determine the level of statistical significance. The calculated P values are shown above the groups that were compared. (B) Kinetics of the viral NP RNA copy number in the blood specimens after the onset of symptoms. The copy numbers in the blood specimens from SFTS patients who died (red) or survived (black) are plotted as dots for each of the collection days (days after the onset of symptoms). Horizontal solid lines for each day indicate the mean RNA copy number in the blood specimens collected from patients who died (red) or survived (black). The dots connected by dashed lines indicate specimens collected from the same patients.
