FIG 2.

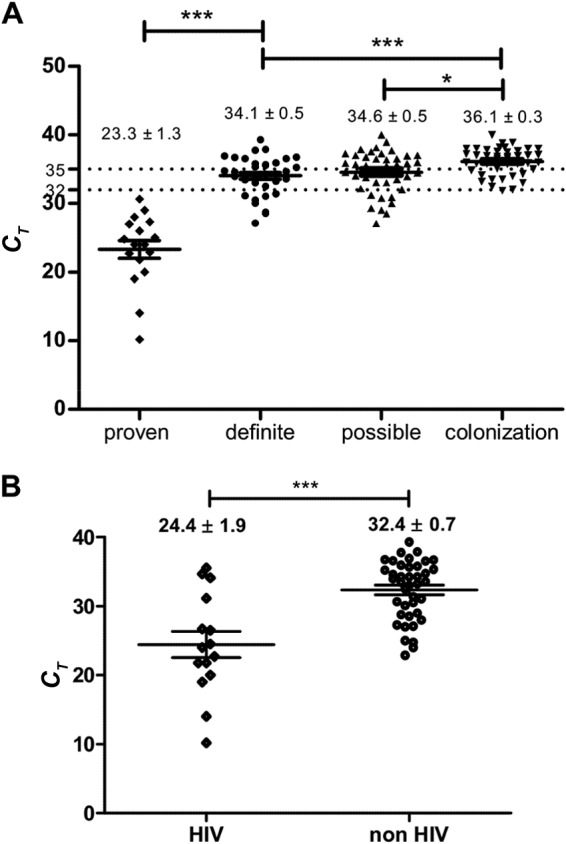
Results of qPCR (CT of amplification) according to final diagnosis (A) or HIV status (B), expressed as the mean ± SEM. The values were compared using t tests. Statistically significant differences are marked as *, P < 0.05 or ***, P < 0.001.

Results of qPCR (CT of amplification) according to final diagnosis (A) or HIV status (B), expressed as the mean ± SEM. The values were compared using t tests. Statistically significant differences are marked as *, P < 0.05 or ***, P < 0.001.