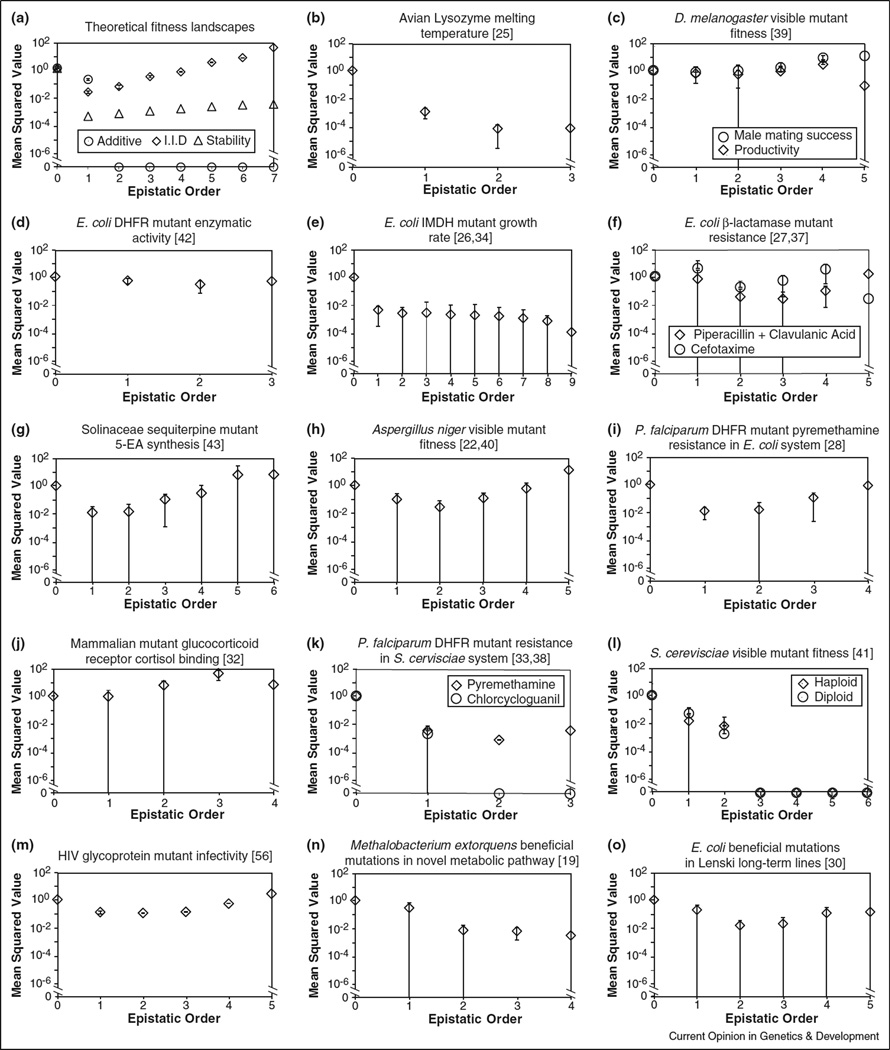
Figure 1.
Epistatic coefficients as a function of order. Because epistatic coefficients may be positive or negative (Box 1), mean squared values are shown. The zeroth-order epistatic coefficient is the mean fitness across all genotypes (see Box 1); in each case here, fitness values were normalized to make this quantity equal to 1.0. First-order and second-order coefficients are analogous to classical selection coefficients and classical pairwise epistasis terms, respectively (see Box 1). Error bars represent standard deviation among coefficients of given order; those that extend to the x-axis overlap 0. (a) Theoretical fitness landscapes. Additive (circle) genotypic fitness values are the sum of the fitness effects of constituent mutations, which in turn were drawn uniformly on the interval [0, 1]. Here, all pairwise and higher epistatic coefficients are zero. I.I.D. (squares) genotypic fitness values were drawn independently and identically from a uniform distribution over [0, 1]. Here, magnitude of mean squared epistatic coefficient increases exponentially with order. We expect empirical results to lie in between these two extremes. Enzyme folding stability model (triangles) considers the fitness landscape defined by 1/(1 + eΔG/kbT) over 7 missense mutations with identical and additive ΔΔG = 1 kcal/mol [44••]. Here ΔG is the free energy of folding, kb is Boltzman’s constant and T is temperature. See text for further details. (b–o) Empirical fitness landscapes in Table 1; citations given in square brackets. Growth rate (panels c, e, h, l, n and o) and drug resistance (f, i and k) values were log-transformed before epistatic coefficients were computed. In cases where more than one combinatorially complete subset of mutations was identified (panels d, g, k, m) results for a randomly selected subset is shown.

