
FIG 2.
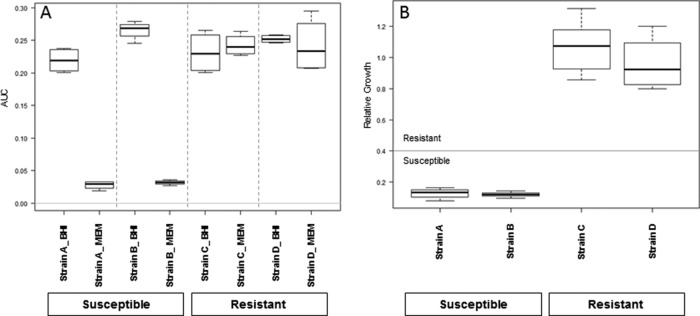
Box plots of the results of the automated evaluation. (A) AUC values obtained for four selected K. pneumoniae strains in the absence or presence of meropenem (64 μg/ml) for 1 h. Results were obtained from four spectra from two separate spots. Susceptible strains show a clear reduction of AUC in the presence of antibiotic. (B) The ratio of the AUC in the presence of antibiotic to that in the absence of antibiotic provides the relative growth. The horizontal line indicates the susceptibility/resistance threshold, the medians are indicated by bold lines, the minima and maxima are indicated by whiskers, and the 25th and 75th percentiles are indicated by boxes.