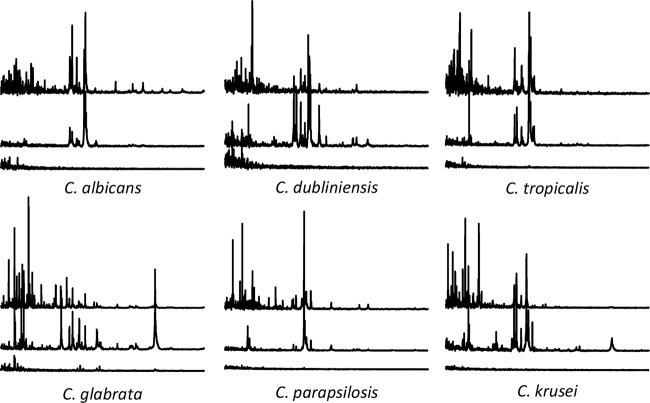
FIG 1.
Comparison of example mass spectra obtained by the different preparation methods. Top spectra, full extraction; middle spectra, OTL method; bottom spectra, smear preparation. The mass range of each spectrum is 2 to 14 kDa (x axis), and the peak intensities (y axis) are set to 15,000 arbitrary units. The acquisition of smear spectra was performed manually, whereas that of OTL and extraction spectra was by automatic mode.

