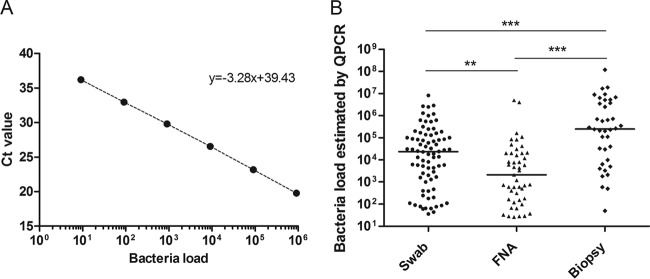
FIG 1.

Quantification of M. ulcerans DNA by qPCR analysis of swabs, FNA samples, and biopsy specimens. (A) Representative external standard curve made from a series of six 10-fold serial dilutions of M. ulcerans DNA. Ct, threshold cycle. (B) Estimation of bacterial loads in swabs, FNA samples, and biopsy specimens (n = 163). **, P < 0.01; ***, P < 0.0001. Bacterial load data show the number of bacteria per ml detected by qPCR.
