
FIG 2.
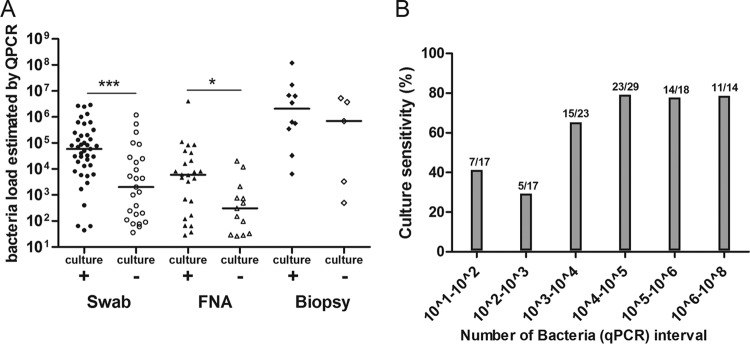
Sensitivity of culture in qPCR-positive specimens. (A) Bacterial load detected by qPCR in swabs, FNA samples, or biopsy specimens divided according to whether they gave positive or negative culture results. *, P < 0.1; ***, P < 0.001. (B) Positive culture rate as a function of bacterial load detected by qPCR in specimens (n = 118). Bacterial load data show the number of bacteria per ml determined by qPCR.