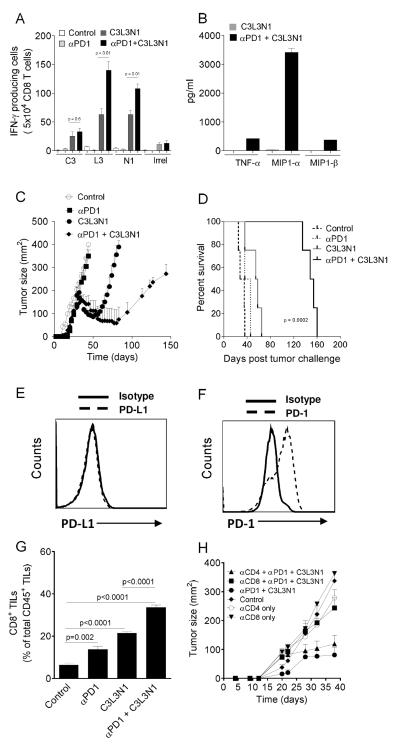
Figure 2. Anti-PD-1 treatment with multi-peptide vaccine enhances immune responses during priming phase and delays recurrence of disease.
(A) Shown are mean ELIspot numbers (±s.e.m. n=3) of IFN-γ producing CD8 T cells, in response to P815 cells pulsed with C3, L3, N1 and control (Irrel) peptides). (B) Shown are the mean (±s.e.m., n=2) cytokine concentrations detected in supernatants of CD8 T cells incubated with P815 cells pulsed with N1 peptide from vaccinated mice. (C) Shown are the tumor growth curves for BALB/c mice (n=4 per group) vaccinated with multi-peptide vaccine and multi-peptide vaccine plus anti-PD-1 antibody. Points, average tumor size; bars, s.e.m. (D) Shown is the kaplan meier survival curve representing different groups of TUBO tumor-bearing BALB/c mice. (E) and (F) Shown are the histograms (gated on R1) representative of PD-L1 and PD-1 expression by TUBO tumor cells. (G) Mean (± s.e.m., n=4) levels of infiltrating CD8 T cells in treated and control animals. (H) Tumor growth curves for different groups of TUBO tumor-bearing BALB/c mice (n=5 per group) treated with or without anti-CD4 or anti-CD8 monoclonal antibodies. Points, average tumor size; bars, SD. Data are representative of one of three (A-F, H) experiments with similar results.

