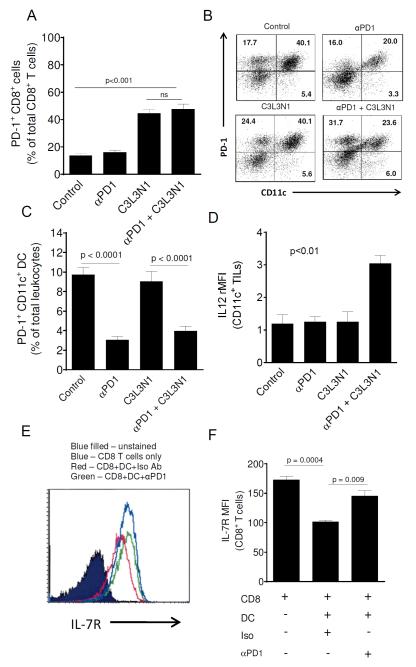
Figure 7. Combination therapy decreased the number of tumor-infiltrating PD-1+ CD11c+ cells and PD-1 blockade on tumor-infiltrating DCs increases IL-7R expression on antigen-primed CD8 T cells.
(A) (B) PD-1+ CD8+ and PD-1+ CD11c+ cells in tumors of different treatment groups was analyzed. (A) Shown are the mean numbers of tumor-infiltrating PD-1+ CD8+ T cells in different treatment groups. (B) Shown are the cytometry dot plots (gated on R1) representative of tumor-infiltrating PD-1+, CD11c+ cells in the different treatment groups. Quadrants were established with isotype controls and the inset values are the percent of R1 gated lymphocytes that fall in that quadrant. Dot plots shown are the representative of one of three separate experiments with similar results. (C) Shown are the mean numbers of tumor-infiltrating PD-1+ CD11c+ cells of total leukocytes in different treatment groups. Data is shown as mean (± s.e.m) and is from three independent experiments. (D) Shown are the mean (±s.e.m., n=3) rMFI values obtained from staining tumor-infiltrating DCs for IL-12. DCs were obtained from tumors between days 35-38. (E) Shown is the histogram representative of IL-7R expression on splenic CD8 T cells co-cultured with tumor derived PD-1+ DCs pretreated with anti-PD-1 antibody or isotype antibody. (F) Shown are the bar graphs representative of IL-7R expression on splenic CD8 T cells. Data is shown as mean (±s.e.m) and is from three independent experiments.

