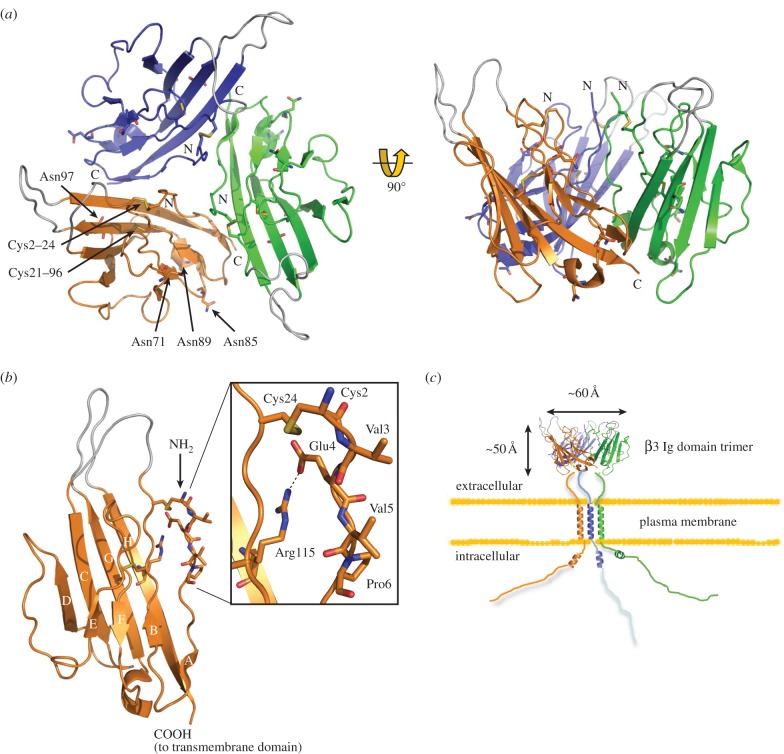
Figure 3.
The atomic resolution structure of the β3 subunit Ig domain (PDB ID code 4L1D). (a) Diagram showing the arrangement of the β3 trimer. Amino (N) and carboxyl (C) termini are labelled. The Cys21–96 disulfide bond and the Cys2–24 disulfide bonds are labelled on the orange protomer. Potential N-linked glycosylation sites Asn71, Asn85, Asn89 and Asn97 are shown as sticks and labelled for the orange protomer. Loops that are not resolved in the electron density maps due to local disorder are shown in grey at their most probable plausible positions. (b) Close-up of the single Nav β3 subunit Ig domain protomer. Residues correspond to loops not visible in the electron density maps due to local disorder are shown in grey. A close-up of the region surrounding the trimer interface is shown in the box. (c) Cartoon of the full-length β3 trimer as it may appear on the plasma membrane, with correct dimensions. Note: in these diagrams, the amino acids are numbered from the first residue of the mature protein (i.e. lacking the endoplasmic reticulum targeting signal) [27].

