
Figure 2. Optical imaging of autophagy in hearts of mCherry-LC3 mice.
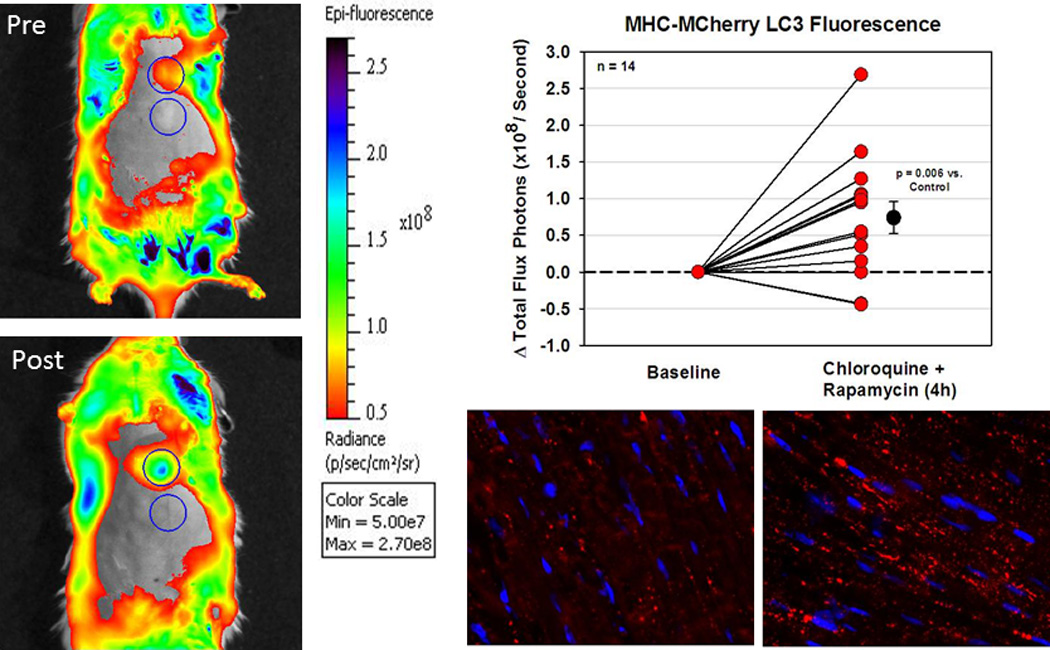
A. Mice were imaged at baseline (Pre) and 4 h after rapamycin and chloroquine administration (Post), using a protocol of 3 acquisitions of 15 sec each. Representative images from a single mouse are shown.
B. Graph shows the change in fluorescence from baseline to 4 h after rapamycin and chloroquine administration (n=14 mice; each point represents the average of 3 acquisitions).
C. Cryosections of typical hearts of mCherry-LC3 mice under fed (left) and fasted (right) conditions, showing the typical increase in total fluorescence as well as the increase in number of fluorescent red puncta (autophagosomes). Nuclei are stained blue with DAPI. (Images from A and B are reprinted with permission from Circulation Research Abstract P066: Imaging Autophagy in Living Mice v109:AP066, 2011. Unpublished images from C provided by Dr. Chengqun Huang and Dr. Roberta A. Gottlieb.)