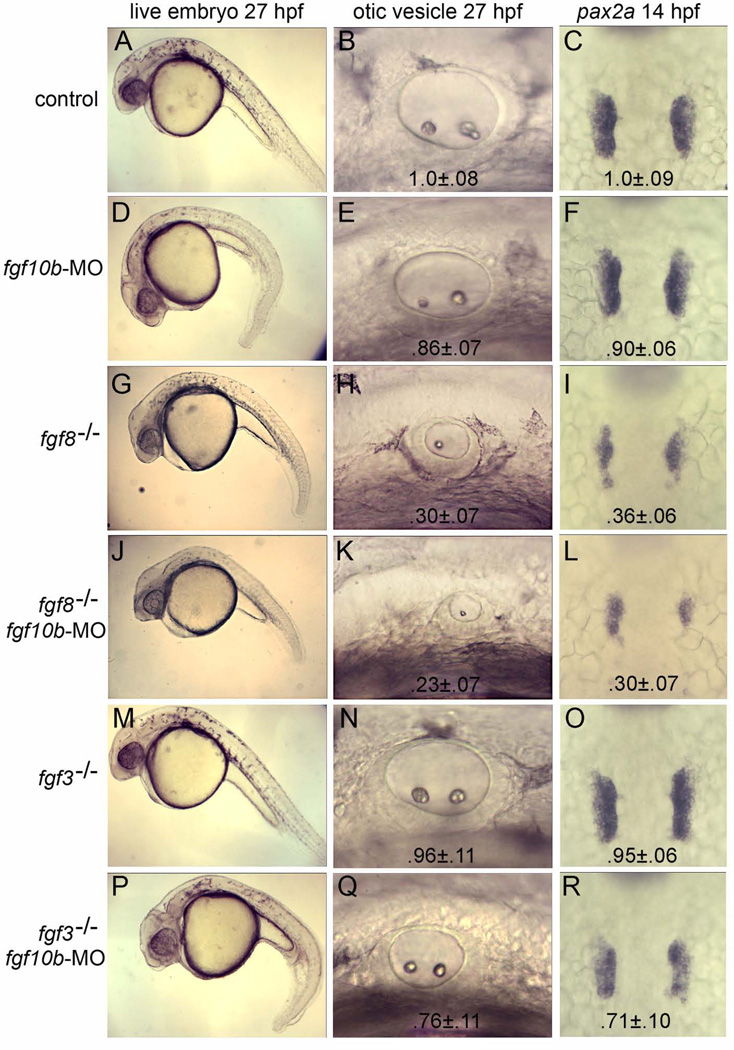
Figure 3.
fgf10b cooperates with fgf3 and fgf8 in otic induction. A–R: Live specimens at 27 hpf viewed at low magnification to show general morphology and high magnification to show otic vesicles; and dorsal views of in situ hybridizations to visualize pax2a in the otic placodes at 14 hpf. Genetic manipulations are indicated down the left side of the figure. Mean surface area (± standard deviation, n≥8) of otic placodes and vesicles, normalized to wild-type control embryos, are indicated for each genotype/knockdown.

