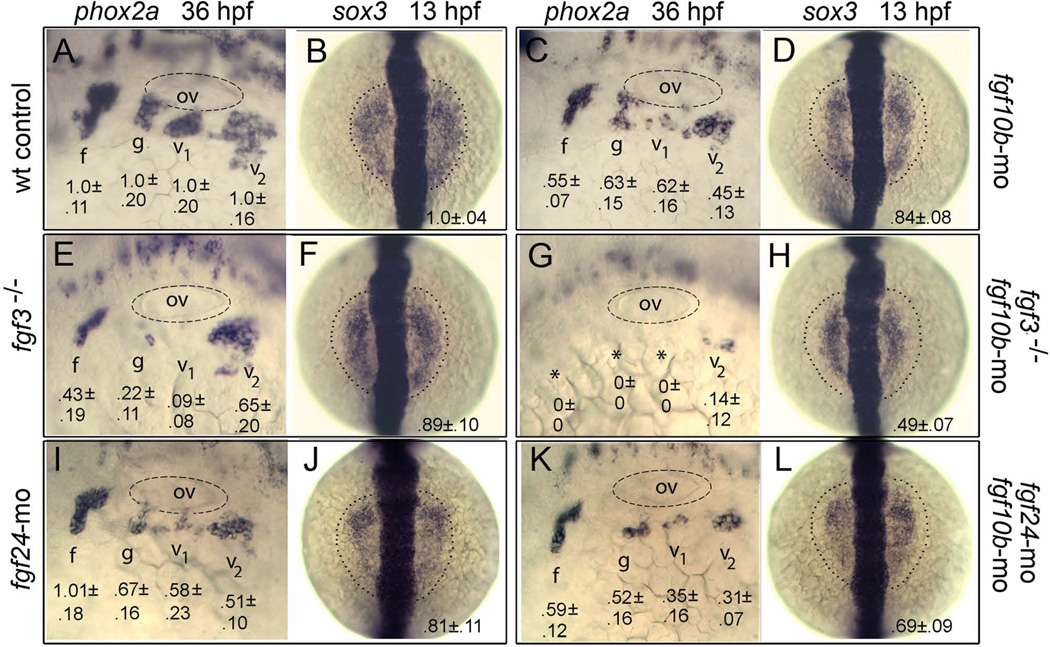
Figure 6.
fgf10b cooperates with fgf3 and fgf24 in epibranchial induction. A–L: Lateral views (anterior to the left) of phox2a expression in epibranchial ganglia at 36 hpf; and dorsal views (anterior to the top) of sox3 expression at 13 hpf (normal boundaries of the control are outlined). Genetic manipulations are indicated along the sides. Positions of the otic vesicle (ov) and facial (f), glossopharyngeal (g) and vagal ganglia (v1 and v2) are indicated. Mean surface areas (± standard deviation, n≥8), normalized to wild-type control embryos, are indicated for each structure.

