. 2014 Oct 21;28:116.
© 2014 Iran University of Medical Sciences
This is an open-access article distributed under the terms of the Creative Commons Attribution NonCommercial 3.0 License (CC BY-NC 3.0), which allows users to read, copy, distribute and make derivative works for non-commercial purposes from the material, as long as the author of the original work is cited properly.
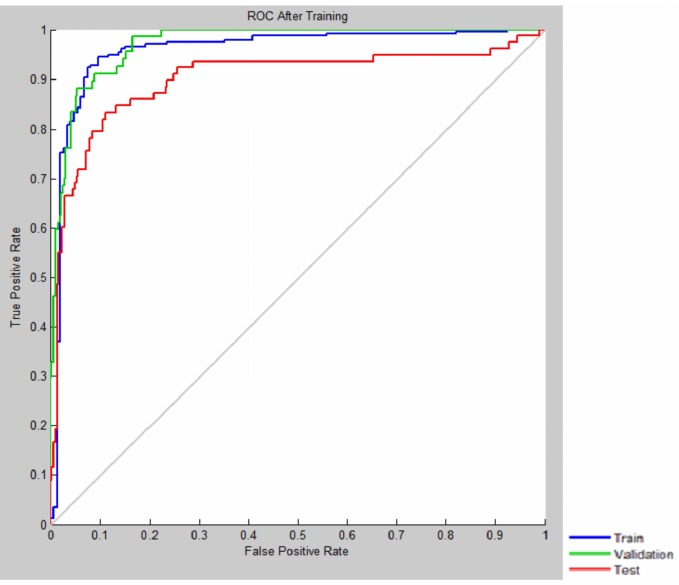
Fig. 1 .

ROC Curve Shows the Model’s Discriminatory Power
