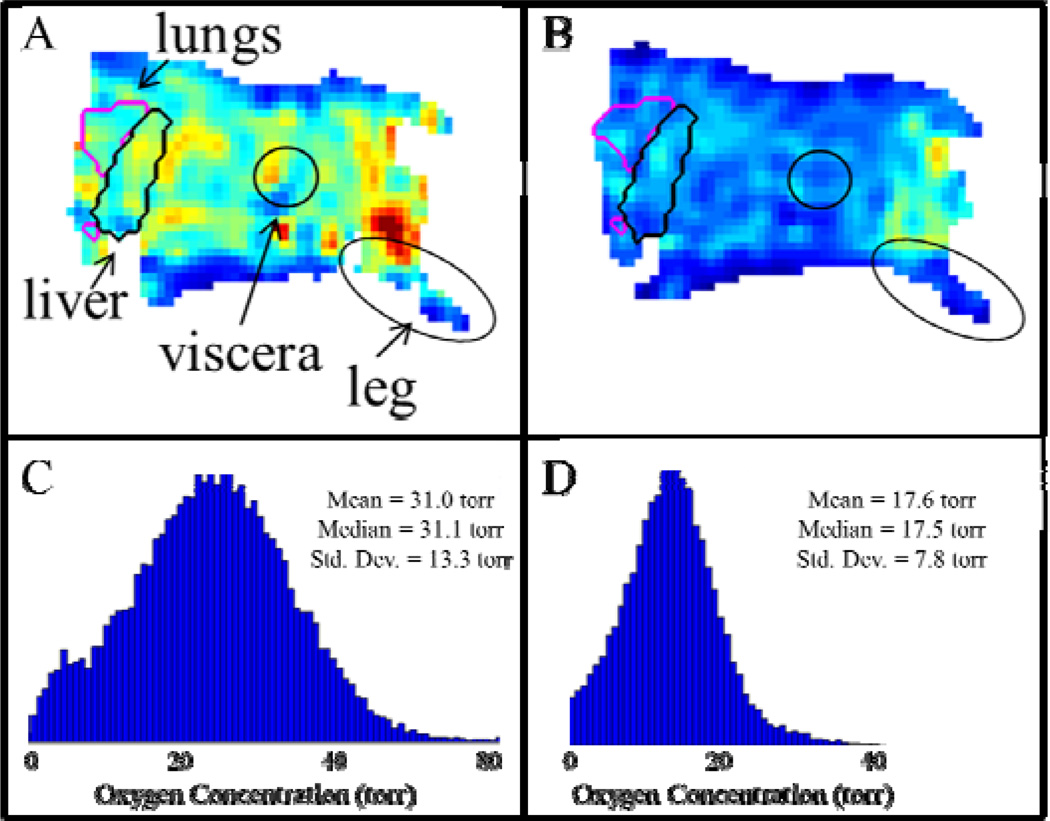
Fig. 2.
Demonstration of the overall effect on the tissue pO2 of a mouse when the breathing gas oxygen content is changed from 21% O2 to 12% O2 as measured with EPROI. Whole body EPROI of a mouse breathing (A) 21% O2 and (B) 12% O2, with labeled regions of interest. The pO2 distributions for the whole body EPROI when the mouse is breathing (C) 21% O2 and (D) 12% O2.

