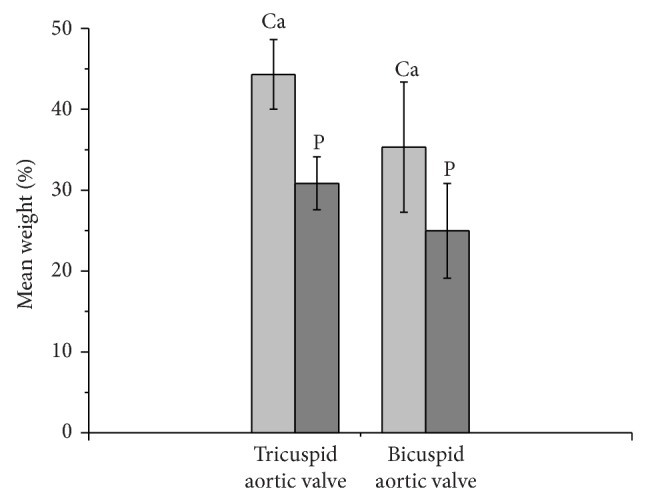
Figure 10.

Comparison between two different types of calcified aortic valve. Histograms showed that the tricuspid aortic valve had a major content of Ca and P (expressed as mean weight %) compared to bicuspid aortic valve. The mean value was calculated on thirty spots taken within each valve. The vertical bars represent the standard deviation.
