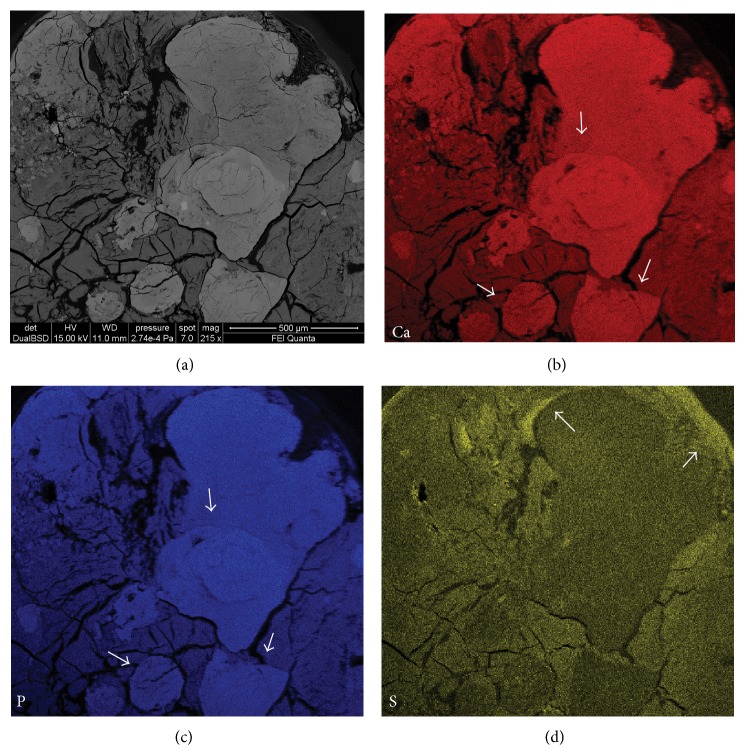
Figure 5.
Elemental maps (sample Tv20ab). (a) BSE-SEM image of the area used to generate elemental maps. (b) Distribution of Ca. (c) Distribution of P. (d) Distribution of S. The arrows in panels (b) and (c) indicate completely mineralized areas characterized by very high concentrations of Ca and P. The arrows in panel (d) indicate high concentrations of S associated only with the extracellular organic matrix surrounding the pathological deposit.

