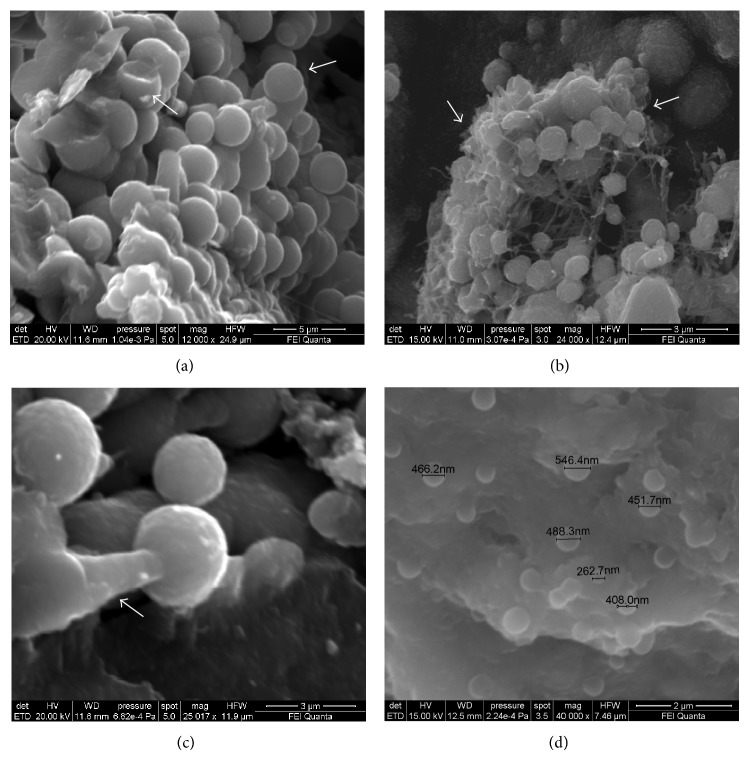
Figure 8.
SEM analysis of pathological biomineralization morphology. (a) Agglomeration of variably sized (micrometer range) calcified nanoparticles, indicated by the arrows (12000x, mitral valve sample). (b) Agglomeration of spherical calcified nanoparticles in a framework of organic filaments (bicuspid aortic valve sample), formed by extracellular matrix proteins. (c) Magnified view (25000x) of individual spherical nanoparticle along a mineralized filament, indicated by the arrow (mitral valve sample). (d) Agglomeration of spherical calcified nanoparticles in the nanometer range at 40000x; the smallest measured nanoparticle was 262.7 nm in diameter (bicuspid aortic valve sample).

