Figure 3.
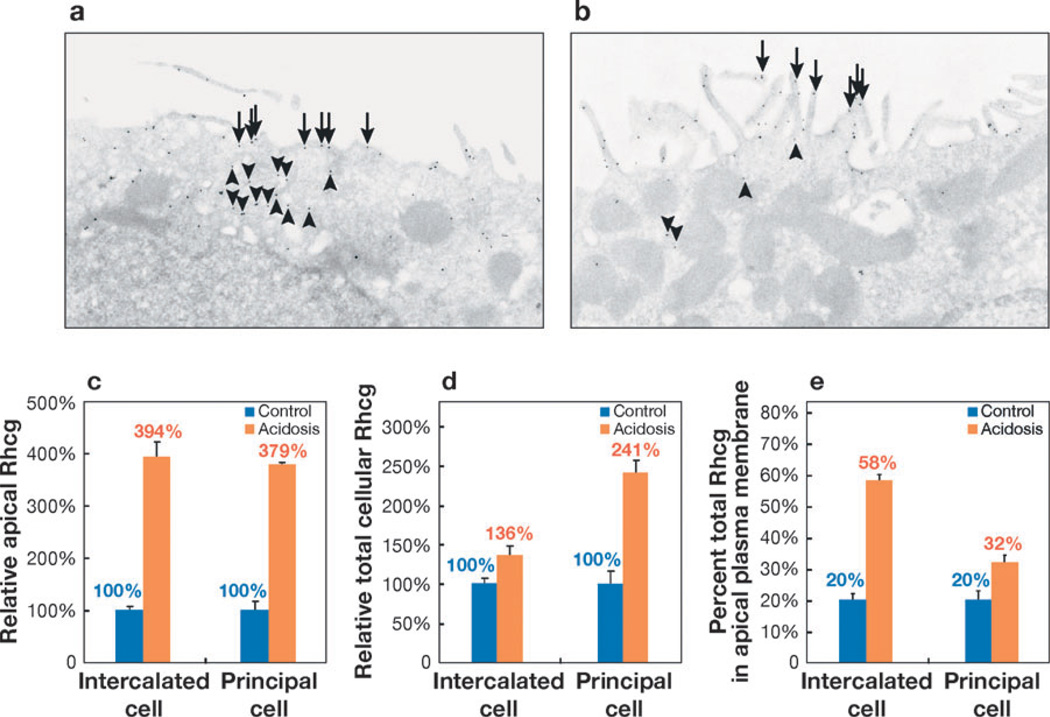
Rhcg expression in the OMCD in response to chronic metabolic acidosis. (a) Under basal conditions Rhcg is present both in the apical plasma membrane (arrows) and in intracellular compartments (arrowheads) in intercalated cells in the OMCD. (b) Chronic metabolic acidosis increases the proportion of Rhcg present in the apical plasma membrane (arrows) and decreases Rhcg present in the intracellular compartment (arrowheads). (c) Chronic metabolic acidosis increases the amount of Rhcg in the apical plasma membrane in both the OMCD intercalated cell and the principal cell as compared with control conditions (100%). The relative increase is similar in intercalated cells and principal cells. Absolute expression (not shown) is greater in the intercalated cell than in the principal cell under both control and acidosis conditions (110). (d) Total cellular Rhcg in intercalated and principal cells in response to chronic metabolic acidosis, expressed relative to total cellular Rhcg in control conditions (100%). Although Rhcg expression increases in both the intercalated cell and principal cell, the relative increase is greater in the principal cell than in the intercalated cell. (e) The proportions of total cellular Rhcg present in the apical plasma membrane in the intercalated cell and principal cell under control conditions and in response to chronic metabolic acidosis. The increase in response to metabolic acidosis is greater in the intercalated cell than in the principal cell. a and b are reprinted from Reference 110, with permission. c, d, and e use data published previously in Reference 110.

