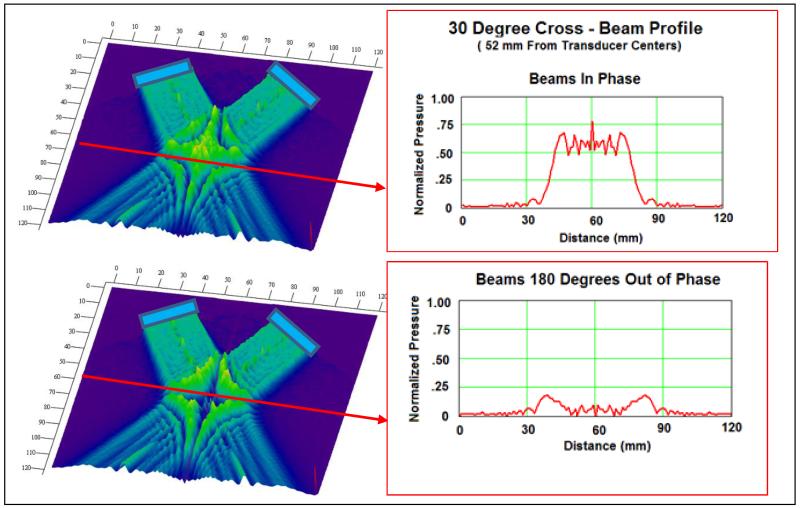
Figure 3.
Mathcad modeling generates the images of acoustic pressure from two transducers (indicated by blue rectangles) rotated 30° towards each other. The interference region is brightest green and appears roughly 52 mm from the center of the transducers. At a cross-sectional depth (indicated by a red arrow), the pressure over width plots are shown for both in-phase and out-of-phase transducer pairs. The out-of-phase interference pressures are notably less than the in-phase.

