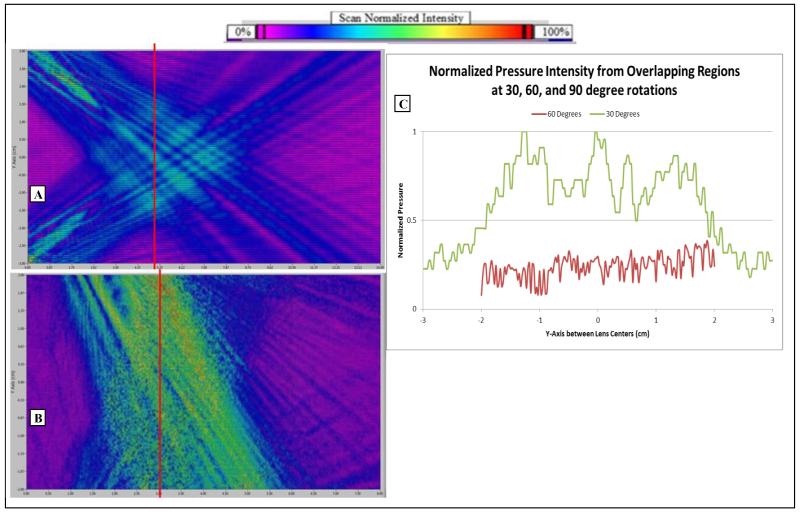
Figure 5.
(A) This image displays the pressure intensity data in a 6 cm by 14 cm plane between two 3MHz transducers rotated 30° to each other. (B) This image is 4 cm by 8 cm between the same transducers now rotated at 60° to each other. The images display the beam scan data as color coded pressure intensity, with red/green intensities greater than blue/indigo. Transducers were located at the top and bottom left corners of the scans. (C) The graph shows the cross-sectional pressures (taken at the red lines of the beam scans) of the interference regions of both scans. 30° configuration shows significantly greater interference pressure intensities.

