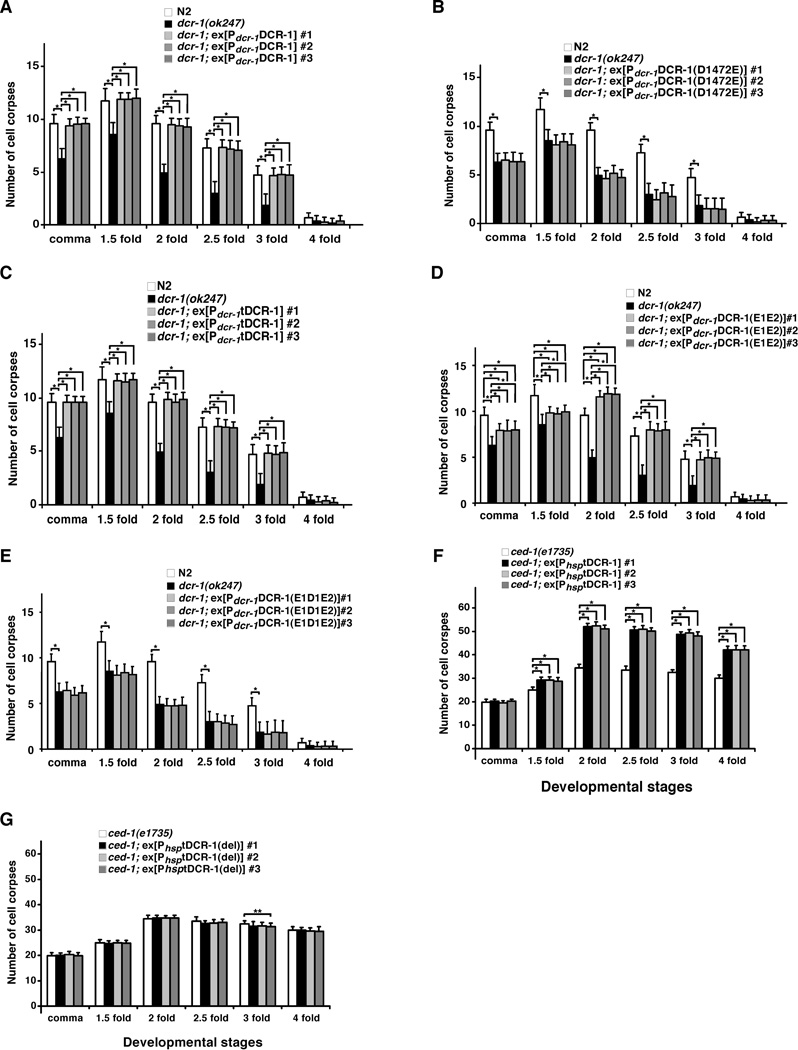
Fig. 4.
Requirement of DCR-1 cleavage by CED-3 for its pro-apoptotic activity. Cell corpses were scored in the following animals: (A) N2, dcr-1(ok247), dcr-1(ok247); ex[Pdcr-1DCR-1] arrays #1–3, (B) N2, dcr-1(ok247), dcr-1(ok247); ex[Pdcr-1DCR-1(D1472E)] arrays #1–3, (C) N2, dcr-1(ok247), dcr-1(ok247); ex[Pdcr-1tDCR-1] arrays #1–3, (D) N2, dcr-1(ok247), dcr-1(ok247); ex[Pdcr-1DCR-1(E1E2)] arrays #1–3, (E) N2, dcr-1(ok247), dcr-1(ok247); ex[Pdcr-1DCR-1(E1D1E2)] arrays #1–3, (F) ced-1(e1735), ced-1(e1735); ex[PhsptDCR-1] arrays #1–3, (G) ced-1(e1735), ced-1(e1735); ex[PhsptDCR-1(del)] arrays #1–3. Stages of embryos examined were: comma, 1.5-fold, 2-fold, 2.5-fold, 3-fold, and 4-fold. The y axis represents average number of cell corpses scored and error bars represent S.D. 15 embryos were counted for each developmental stage. The significance of differences between different genetic backgrounds was determined by two-way ANOVA, followed by Bonferroni comparison. *, P < 0.001; **, P < 0.05. All other points had P values > 0.05.

