
Figure 8.
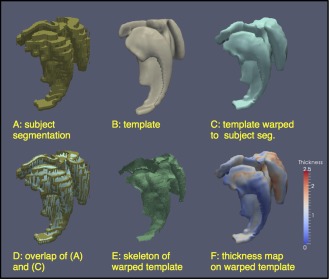
Steps in the thickness computation pipeline. (A) A surface mesh of the combined segmentation of the CA, SUB, ERC, and PRC structures in the right hemisphere in one subject; the step edges in the segmentation can be observed. (B) The surface mesh for the same set of structures in the unbiased population template constructed from 85 ASHS segmentations; the surface of the mesh is much smoother. (C) The smooth template surface warped to the space of the subject's segmentation. (D) Superimposition of the segmentation (A) and the warped template (C) showing that (C) provides a smooth approximation to (A). (E) Pruned Voronoi skeleton computed from the warped template surface. (F) Thickness (distance to the skeleton) mapped onto the boundary of the warped template. [Color figure can be viewed in the online issue, which is available at http://wileyonlinelibrary.com.]