
Figure 9.
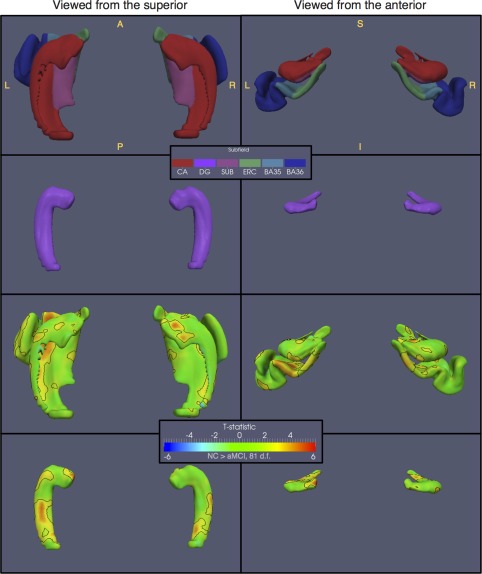
Surface‐based statistical analysis of thickness differences between controls and aMCI patients, performed in the space of an unbiased population template derived from ASHS segmentation, and visualized from two different viewpoints. The top row shows the combined surface model composed of the CA, SUB, ERC, BA35, and BA36 subfields, with each vertex assigned the corresponding subfield label. The second row shows the DG, which is modeled as a separate surface. The third and fourth rows plot the t‐statistic maps for the statistical comparison of thickness, with age and intracranial volume (ICV) as covariates, between NC and aMCI groups, carried out on these surface models. The dark outline on the t‐statistic maps indicates the regions where the P‐value is below 0.05 after FDR correction. [Color figure can be viewed in the online issue, which is available at http://wileyonlinelibrary.com.]