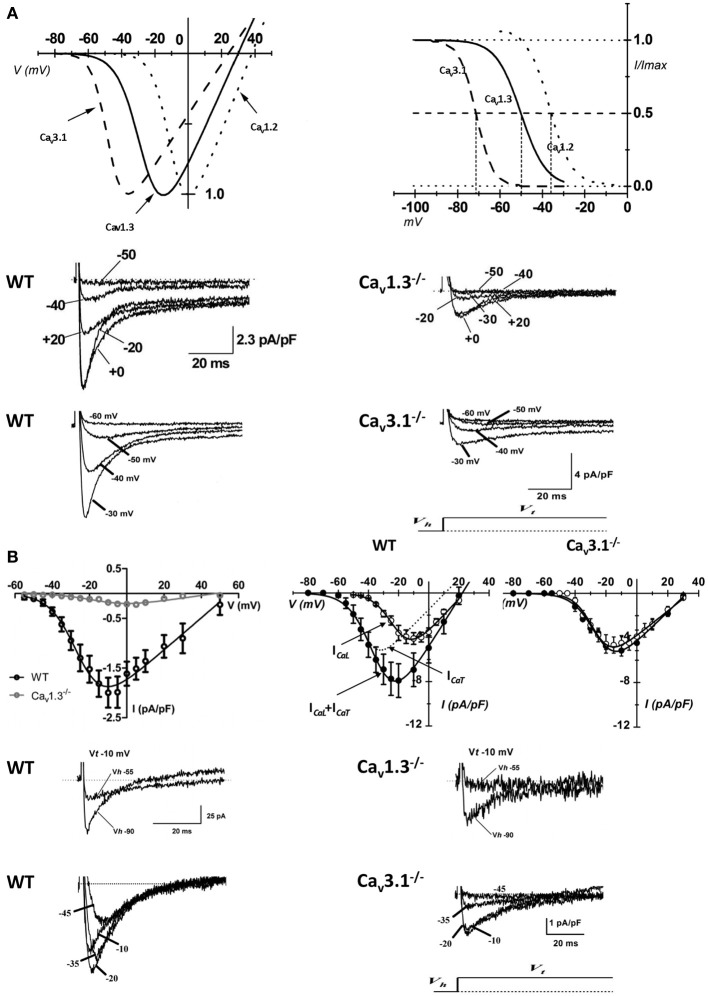
Figure 2.
Properties of VGCCs in cardiac pacemaker cells. (A) I–V curve (top left panel) and steady-state inactivation (top right panel) of native SAN Cav3.1 (dashed curve), Cav1.3 (solid curve), and Cav1.2 (dotted curve) channels (reprinted from Mangoni et al., 2006a, with permission from Elsevier). Examples of voltage dependent calcium currents recorded in pacemakers cells from WT (middle and bottom left panel), Cav1.3−/− (middle right panel) and Cav3.1−/− mice (bottom right panel). (B) Top left panel: I–V curve of L-type Ca2+ channels obtained from WT (black open circles) and Cav1.3−/− (gray open circles) isolated AVN cells. Top right panels: current to voltage relationship in isolated AVN cells from WT and Cav3.1−/− mice. Sample traces of ICa,L (middle panels) and ICa,T (bottom panels) recorded in isolated AVN cells from WT, Cav1.3−/− and Cav3.1−/− mice. For ICa,L recordings the holding potential (Vh) was set at −55 mV, for Cav3.1 at −90 mV. Test potential (Vt) is reported near the trace (reprinted from Mangoni et al., 2006b with permission from Wolters Kluwer Health).

