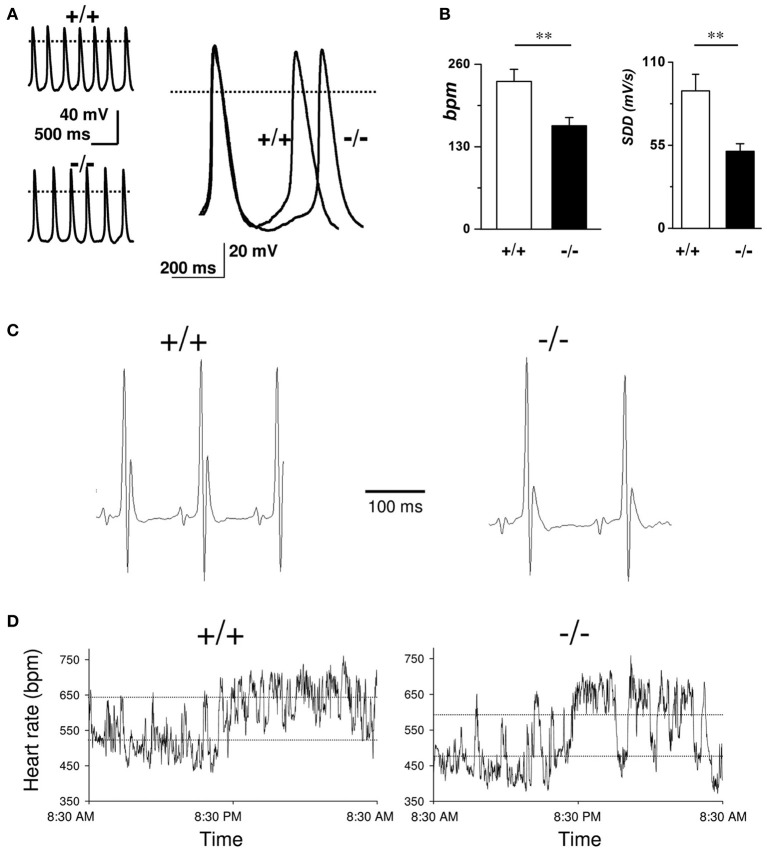
Figure 3.
Role of T-type VGCCs in cardiac automaticity. (A) Representative sweeps of spontaneous action potentials obtained from SAN cells from WT (upper left trace) and Cav3.1−/− mice (lower left trace). Right panel: Superimposition of typical action potentials from a WT and from Cav3.1−/− SAN cell. (B) Histograms of the average bpm value and the slope of the diastolic depolarization (SDD). (C) Representative telemetric ECG recordings obtained on WT (left panel) and Cav3.1−/− animals (right panel). (D) Variation of heart rate (in bpm) in WT (left panel) and Cav3.1−/− mice (right panel) over a 24-h period. Dashed lines indicate mean day and night heart rates (reprinted from Mangoni et al., 2006b with permission from Wolters Kluwer Health).

