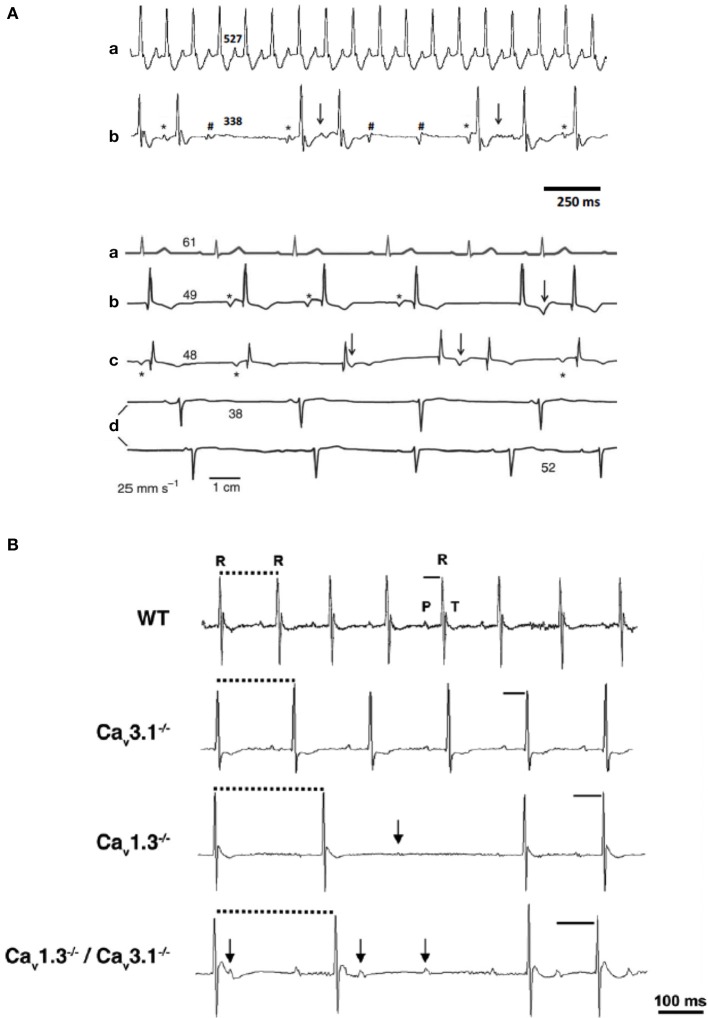
Figure 4.
Cardiac VGCCs in cardiac automaticity pathology. (A) ECG sample recordings from WT (a) and Cav1.3−/− mice (b). (B) ECG recordings from a healthy person (a) and three individuals with SANDD syndrome (b–d). Asterisks mark P waves that precede QRS complexes; arrows indicate waveforms that suggest P waves coinciding with T waves; hashes indicate not conducted P waves. Numbers indicate heart rate (bpm) calculated from the corresponding beat-to-beat R-R interval (adapted from Baig et al., 2011). (B) Telemetric surface ECGs of freely moving WT, Cav3.1−/−, Cav1.3−/−, and Cav1.3−/−/Cav3.1−/− mice showed additive effect of Cav gene inactivation on atrioventricular conduction dysfunction. Solid bars indicate PQ interval, dotted bars indicate RR intervals and arrows indicate isolated P waves (reprinted from Marger et al., 2011a with permission from Taylor and Francis LLC http://www.tandfonline.com).

