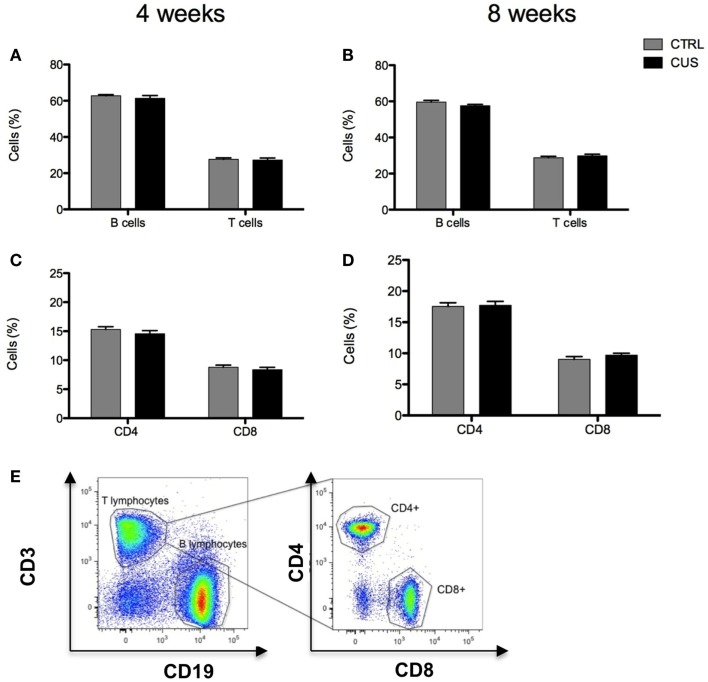
Figure 6.
Impact of 4 vs. 8 weeks of CUS on lymphoid cellular populations in the spleen. Percentage of T and B cells in spleen after exposure to 4 (A) and 8 (B) weeks of CUS. Percentage of CD4+ and CD8+ T cells in spleen after exposure to 4 (C) and 8 (D) weeks of CUS. Flow cytometry plot showing the gating strategy for T and B-lymphocytes (gates) (E). Each bar represents the mean ± SEM from eight animals per group.

