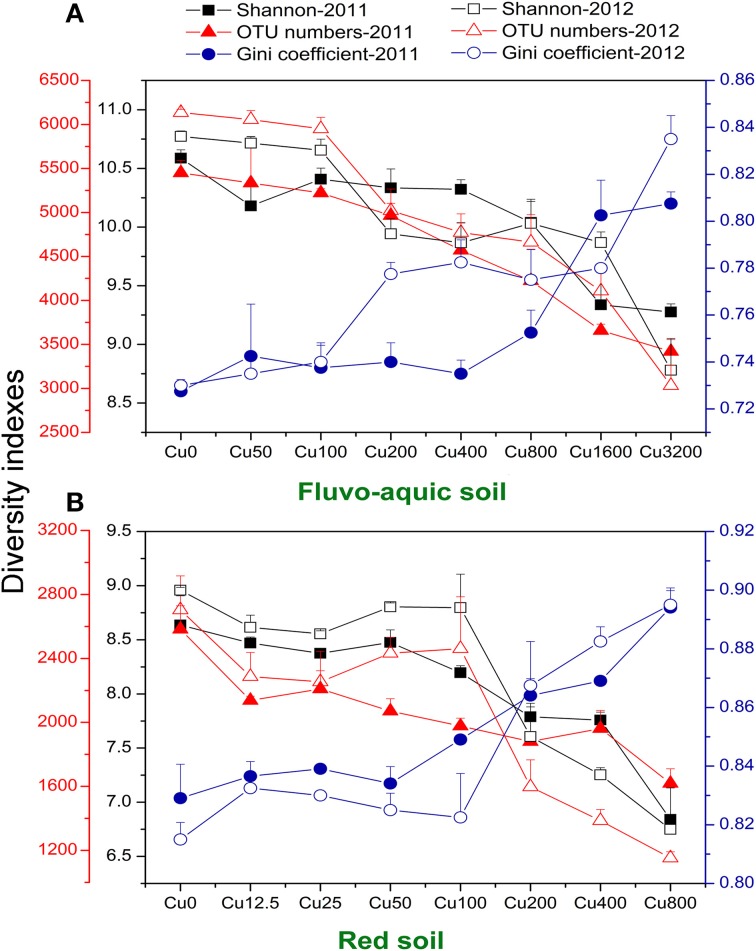
Figure 3.
Variations of soil microbial diversity along the copper gradients in both years of the fluvo-aquic soil (A), and red soil (B). The dark blue y-axis indicates the Gini coefficient. The red and black y-axes indicates the OTU numbers and Shannon index, respectively. Error bars represent standard errors (n = 4).

