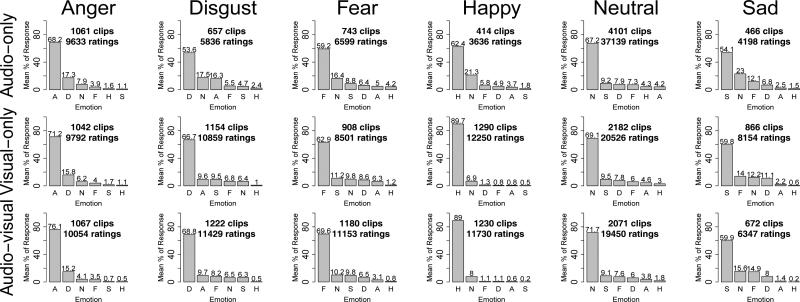
Fig. 3.
The distributions of response when anger, disgust, fear, happy, neutral, and sad are the primary perceived emotion in three modalities of audio-only, visual-only, and the audio-visual multimodal The percentage of emotion is shown per emotion in order of ranking, from most number of clips to least number of clips. A-anger, D-disgust, F-fear, H-happy, N-neutral, S-sad.

