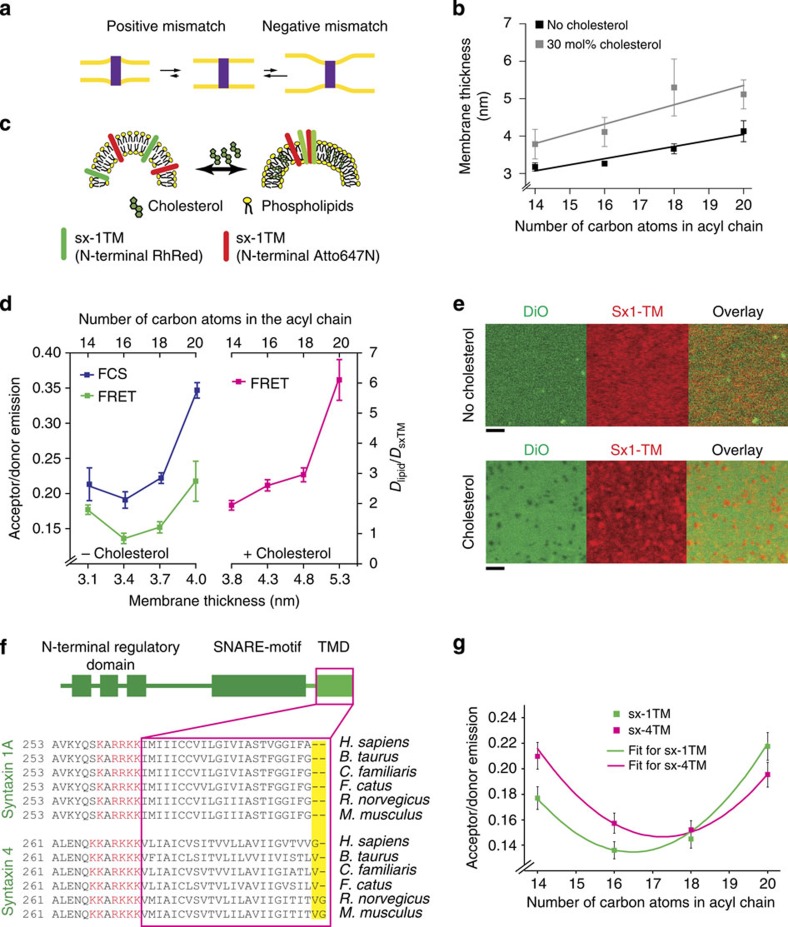
Figure 1. Clustering of syntaxin isoforms by hydrophobic mismatch.
(a) Positive and negative hydrophobic mismatch caused by differences between membrane thickness and TMD length. (b) Bilayer thickness determined by imaging ellipsometry of supported lipid bilayers composed of C14:1, C16:1, C18:1 and C20:1 PC with and without 30 mol% cholesterol (three independent experiments±s.d.). Solid lines show linear regression analyses (slopes of 0.15 and 0.25 for without and with cholesterol, respectively). (c) Scheme of the clustering assay for sx-1TM in 100 nm sized liposomes using FRET. A mixture of sx-1TM was used that was N-terminally labelled with Rhodamine Red and Atto647N. (d) Clustering determined by FRET using liposomes composed of PC of increasing acyl-chain lengths, without (green) and with (pink) 30 mol% cholesterol. Independently, normalized lateral diffusion coefficients of sx-1TM labelled with Atto647N were determined by FCS (blue). Error bars: range from two independent reconstitutions, three technical repeats each. (e) Clustering of sx-1TM (labelled with Rhodamine Red) in supported lipid bilayers (C18:1 PC) in the absence (top) and presence (bottom) of 30 mol% cholesterol measured by confocal microscopy. The membrane was visualized with the lipophilic dye DiO. (Scale bars, 2 μm) (f) Domain organization and alignment of the TMD regions of syntaxin 1 and syntaxin 4. The TMDs and adjacent polybasic patches are marked in magenta and red, respectively. (g) Clustering of human sx-1TM (green) and sx-4TM (magenta) measured by FRET without cholesterol as in d. Solid lines show fits with quadratic curves. Error bars: range from two independent reconstitutions, three technical repeats each.

