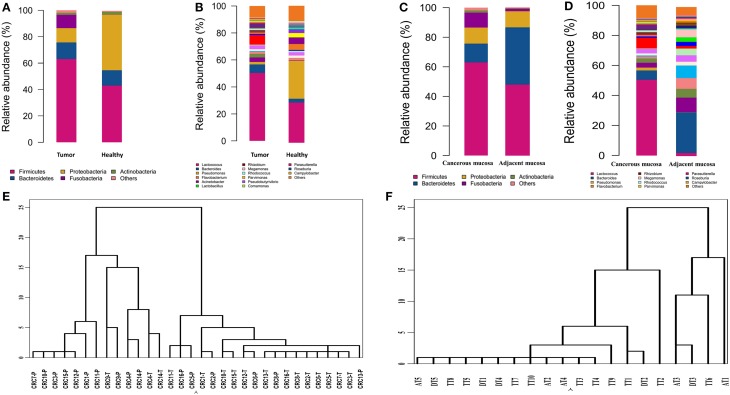
Figure 2.
Different structures of gut microbiota between healthy individuals and CRC patients. (A) The dominant phyla of group tumor and healthy. (B) The dominant genera of group tumor and healthy. (C) The dominant phyla of group cancer and non-cancerous mucosa. (D) The dominant genera of group cancer and cancerous mucosa. (E) Hierarchical clustering of phylotype relative abundance measurements demonstrates that microbial composition of tumor samples from different individuals is more highly correlated than tumor/health samples within individuals. (F) Hierarchical clustering of proximal and distal CRC.

