Figure 3.
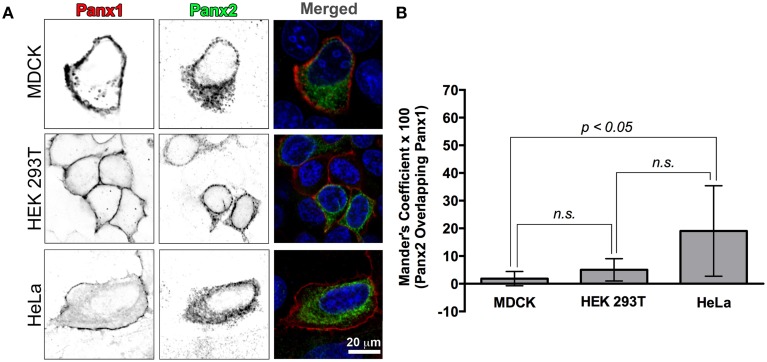
Recombinant Panx1 and Panx2 have non-overlapping cellular distributions in various cell lines. (A) MDCK, HEK 293T, and HeLa cells were co-transfected with wild type untagged Panx1 and Panx2. Images are single confocal slices. In the single channel confocal images (left and middle columns), the color table has been inverted for better visualization of the individual fluorescence channels and in particular, vesicle populations. Panx1 was labeled with a mouse monoclonal antibody (Cy5 secondary antibody detection, shown in red in the merged image) while our polyclonal C-terminal Panx2 antibody was used to stain Panx2 (FITC secondary detection, shown in green in the merged image). In all three cell types, Panx1 was found mostly in the plasma membrane (left column, red color in the “Merged” images in the right hand column) while Panx2 remained in intracellular locations (middle column, green color in the Merged images in the right hand column). In the right hand column images (“Merged”), the nuclei are stained with DAPI (blue). We calculated a Manders' colocalization coefficient in order to quantify the degree of overlap of Panx1 and Panx2 in these cell lines. The graph of average percent overlap (as indicated by the Manders' coefficient × 100) shown in (B) demonstrates that there is very little overlap (20% and below) between Panx1 and Panx2 in these three cell types with significantly higher overlap in HeLa cells. The numbers of images analyzed were 8, 7, and 11 for HEK 293T cells, HeLa cells and MDCK cells, respectively. Error bars indicate standard deviations. (n.s., not significant).

