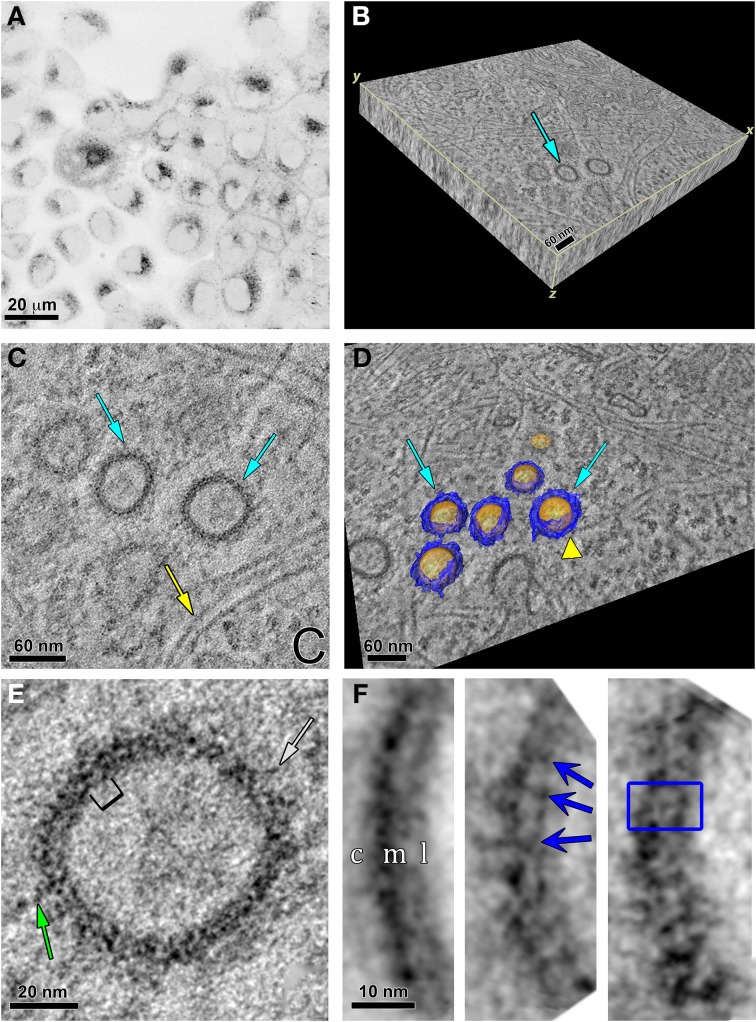
Figure 7.
Specific labeling of Panx2-4Cys and electron tomography highlight Panx2 distribution in the membrane of intracellular vesicles. (A) MDCK cells stably expressing Panx2-4Cys were stained with ReAsH-EDT2, fixed and imaged with a confocal microscope before photooxidation. The image is displayed with an inverted color table (black is the highest fluorescence signal, white is no signal). (B) 3D representation of the EM tomographic volume as a 3D slab. Cyan arrow points to vesicles containing Panx2-4Cys oligomers. (C) Single X-Y slice from the tomogram showing Panx2-4Cys labeling in vesicle cross-sections (cyan arrows). Note the actin filaments in close proximity to the Panx2-4Cys-labeled vesicles (yellow arrow). (D) Automated segmentation of Panx2 vesicles (cyan arrows): yellow represents the lipid bilayer of the vesicle, while blue highlights the large domains of the Panx2 oligomers protruding from the vesicle membrane into the cytoplasm. The yellow colored arrowhead indicates an actin filament in close apposition to a vesicle. Based on comparisons with connexin channels, these protrusions most likely are from the large cytoplasmic domains of Panx2-4Cys. (E) Single slice of the tomogram showing a subarea of a Panx2-4Cys containing vesicle. Here stain-excluding areas (protein and lipid) are white and stain is black. The green arrows point to stained fine protrusions from the cytoplasmic surface of the vesicles. The bracket indicates an area bounded by stain that is ~8 nm. By analogy with connexin hemichannels, this distance should correspond to approximately the diameter through the membrane bound portion of Panx2 channels. (F) Three representative class averages obtained by single particle analysis of boxed cross-sectional areas. In the left hand average, c, cytosolic side; m, membrane; l, lumen of vesicle. Note the thicker cytosolic staining due to the deposition of DAB/osmium to the side containing the 4Cys/ReAsH tag. The blue arrows in the middle average and box in right hand average highlight substructure defined by stain from the Panx2 pore within the membrane bound portion (right hand average: inside box dimensions = ~8 × 10 nm).

