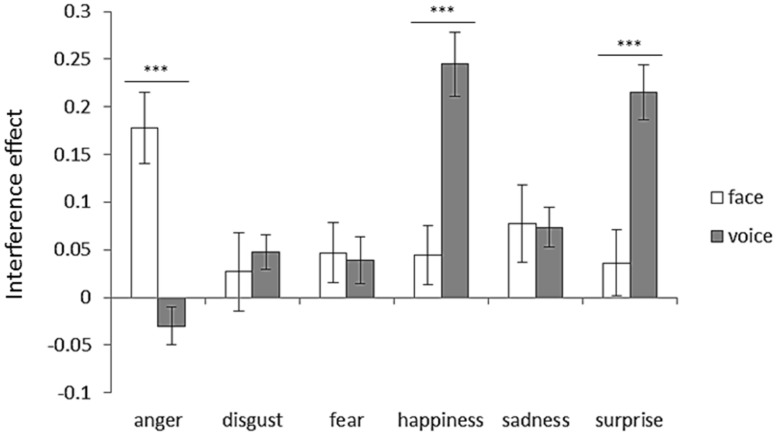
FIGURE 7.
Interference effect for each emotion category with respect to attended modality. Error bars represent SE. Asterisks indicate significant differences between attended modalities (***p < 0.001). “V > A” in Table 3 was the case that the bar length of the face was shorter than that of the voice, and “A > V” in Table 3 was the case that the bar length of the voice was shorter than that of the face.

