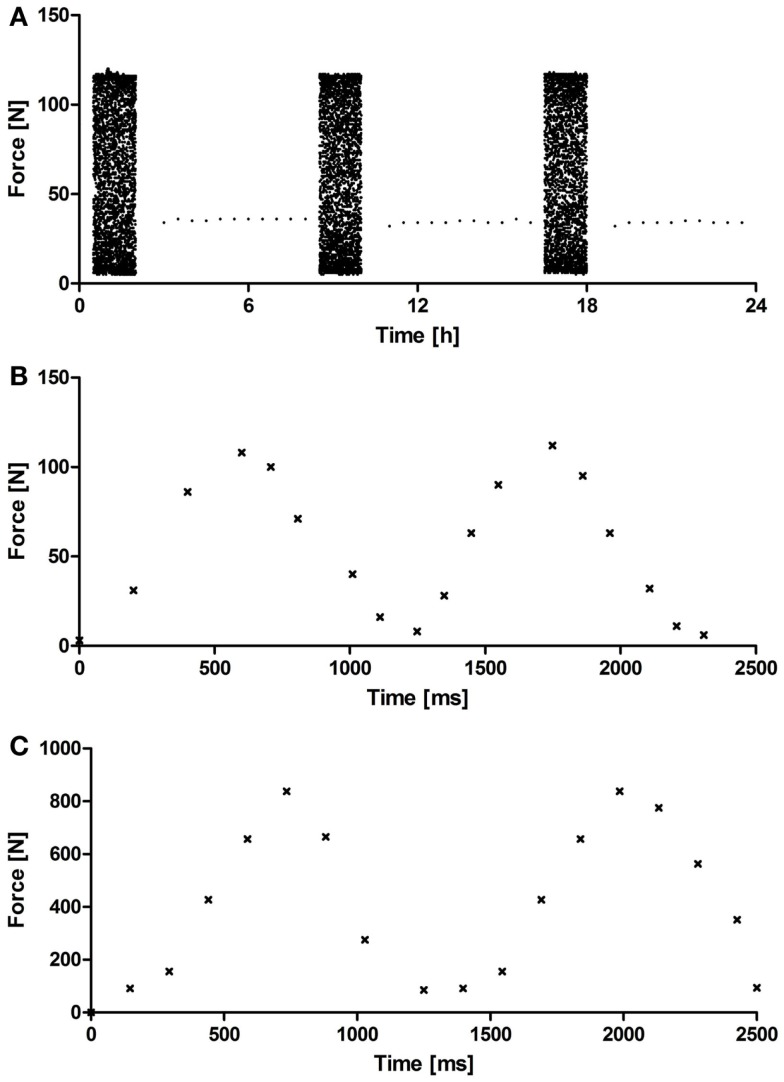
Figure 2.
Representative acquisition diagram from a force sensor. (A) Representative force diagram acquired during 24 h of mechanical loading showing loading (2 h) and resting phases (4 h) for OPTIMAIX-based constructs (n = 4). Representative force diagram acquired during 2.5 s of loading showing the frequency (1 Hz) and periodicity of the sinusoidal wave for (B) OPTIMAIX- and (C) NiTi-based constructs (n = 4).

