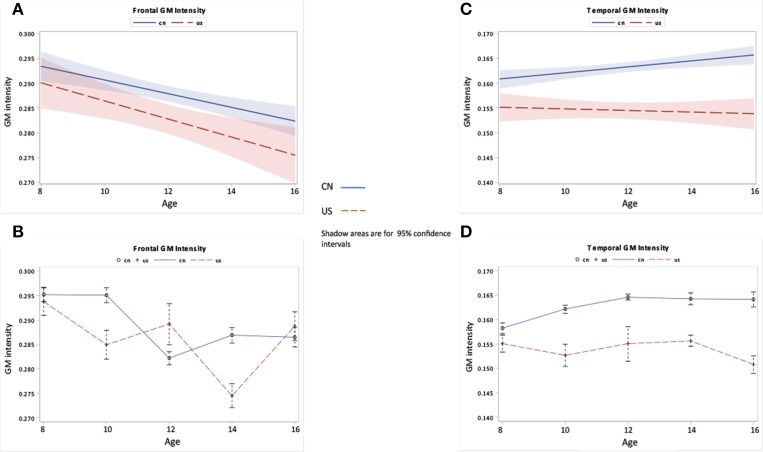
Figure 6.
Frontal and temporal GM changes as a function of age and nationality. (A,B) Frontal GM development over ages for Chinese and U.S. children. (C,D) Temporal GM development over ages for Chinese and U.S. children. The top panel (A,C) shows the regression lines with 95% confidence intervals (CIs) for the development of GM, while the bottom panel (B,D) shows the GM development patterns with average and standard errors for each age group.

