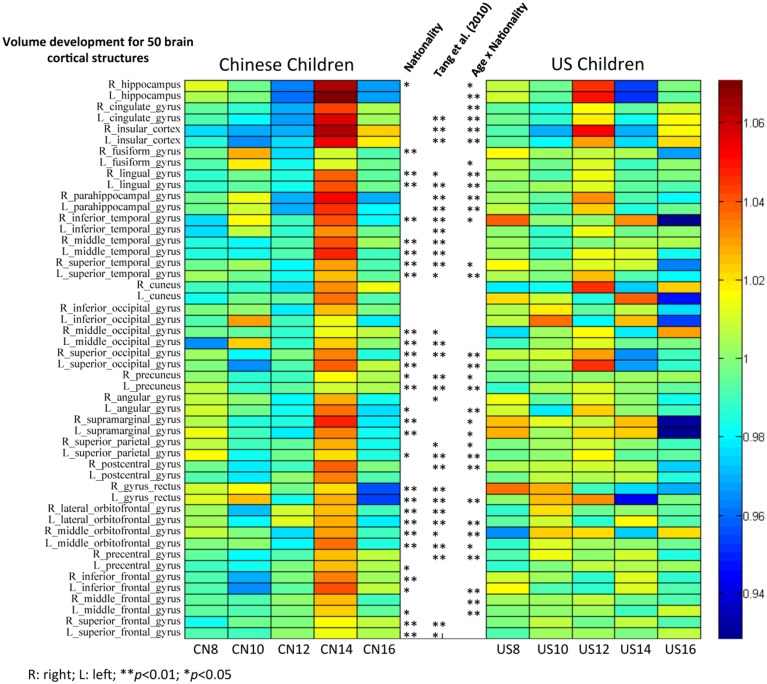
Figure 8.
The volume comparisons of 50 brain cortical structures between Chinese and U.S. children brains. Subjects were grouped with two years increment. Mean volume proportion for the 50 brain structures were calculated for Chinese and U.S. children separately. Each single cell/grid stands for the ratio of the volume for a particular brain structure for that age group to the average for all age groups. Stars stand for the significant nationality effect found for particular structures. Stars on the left indicate the results for comparisons between Chinese and U.S. children from our study, and stars on the right indicate the results from Tang et al. (2010) with adults.

