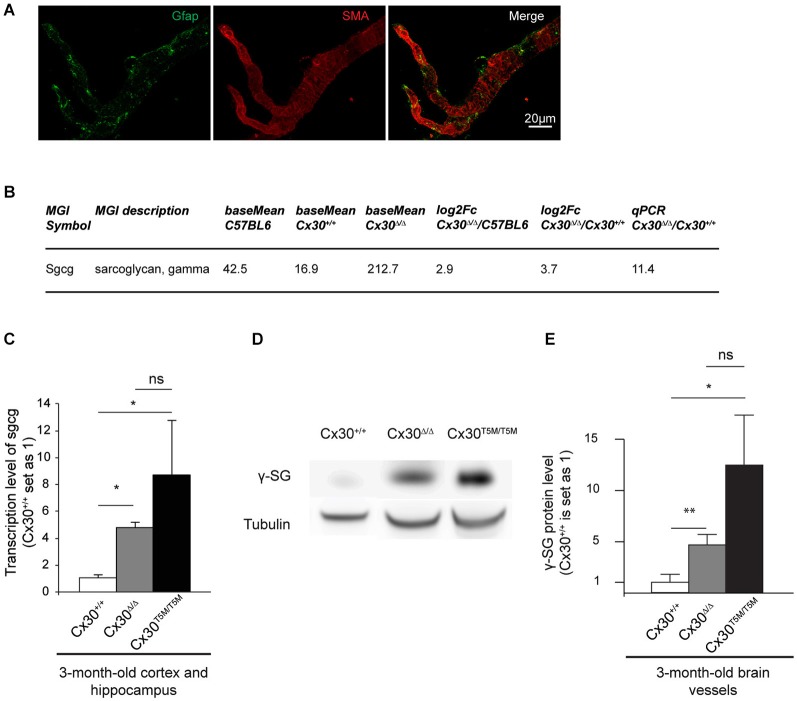
Figure 3.
Impairment of Cx30 channels upregulates the expression of γ-Sarcoglycan in brain vessels. (A) Characterization of purified brain vessels by Gfap and SMA (Smooth Muscle alpha-Actin) immunostaining. (B) Upregulation of Sgcg in brain vessels purified from 3-month-old Cx30Δ/Δ compared to Cx30+/+ and C57BL6 control mice revealed by RNA sequencing. Base mean indicates the number of reads, Fc indicates Fold change. On the right, Validation of the RNAseq result by qPCR on RNAs purified from brain vessels of Cx30Δ/Δ relative to Cx30+/+ control mice. Cx30+/+ value is set as 1. (C) qPCR analysis on 3-month-old Cx30+/+ compared to Cx30Δ/Δ and Cx30T5M/T5M cortex and hippocampus. Cx30Δ/Δ, 5.0 ± 0.6 n = 4; Cx30T5M/T5M, 8.6 ± 1.4 n = 4; Cx30+/+, 1.0 ± 0.1 n = 3. Data are presented as means ± SEM. Mann-Whitney two-tailed test. Cx30+/+ vs. Cx30Δ/Δ or Cx30T5M/T5M, *p = 0.05; Cx30Δ/Δ vs. Cx30T5M/T5M ns, p = 0.5. (D) Western-blot of γ-SG (30 kDa) in 3-month-old Cx30+/+, Cx30Δ/Δ and Cx30T5M/T5M purified brain vessels. Tubulin (50 kDa) was used as the loading control. (E) Western blot quantifications. Cx30Δ/Δ, 4.7 ± 1 n = 5; Cx30T5M/T5M, 12.5 ± 4.9 n = 3; Cx30+/+, 1.0 ± 0.4 n = 6. Data are presented as means ± SEM. Mann-Whitney two-tailed test. Cx30+/+ vs. Cx30Δ/Δ, **p = 0.009; Cx30+/+ vs. Cx30T5M/T5M, *p = 0.02; Cx30Δ/Δ vs. Cx30T5M/T5M ns p = 0.07.

