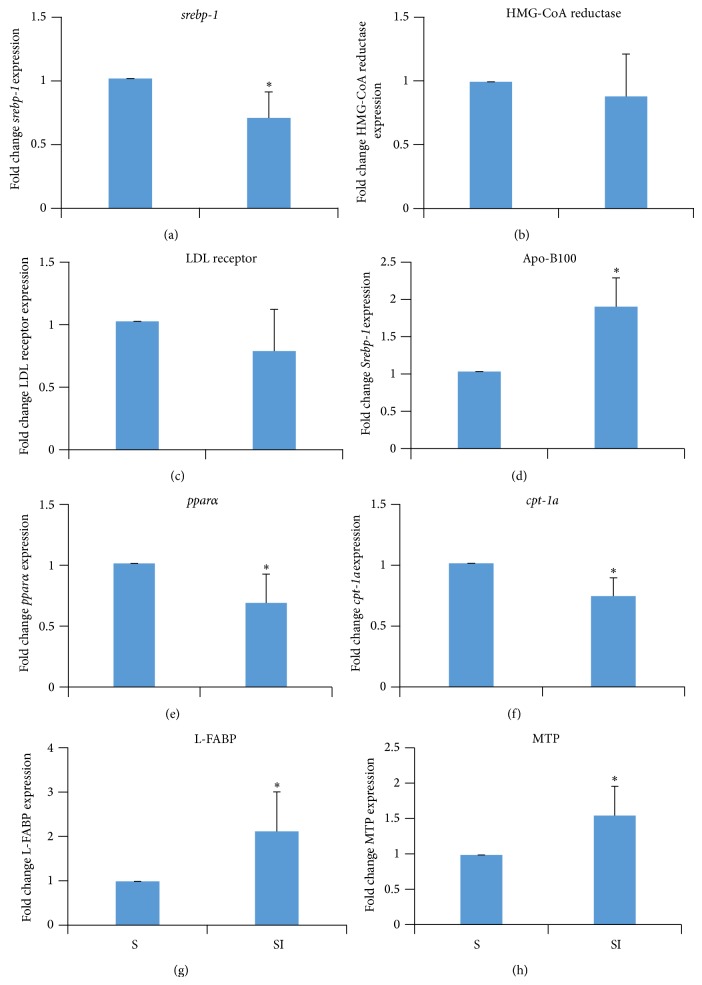
Figure 2.
Levels of gene expression in the liver of rats offered a standard diet (S) and rats that received injections of iron dextran (SI). Values are the mean ± standard deviation (n = 7). (a) Levels of relative srebp-2 (sterol regulatory element-binding proteins-2)/18S expression. (b) Levels of relative HMG-CoA reductase/18S expression. (c) Levels of relative LDL receptor/18S expression. (d) Levels of relative ApoB100 (apolipoprotein B-100)/18S expression. (e) Levels of relative PPAR alpha (peroxisome proliferator-activated receptor alpha)/18S expression. (f) Levels of relative cpt1a (carnitine palmitoyltransferase 1)/18S expression. (g) Levels of relative L-FABP (liver fatty acid binding protein)/18S expression. (h) Levels of relative MTP (microsomal triglyceride transfer protein)/18S expression. * P < 0.05 with respect to the S group (student's t-test).

