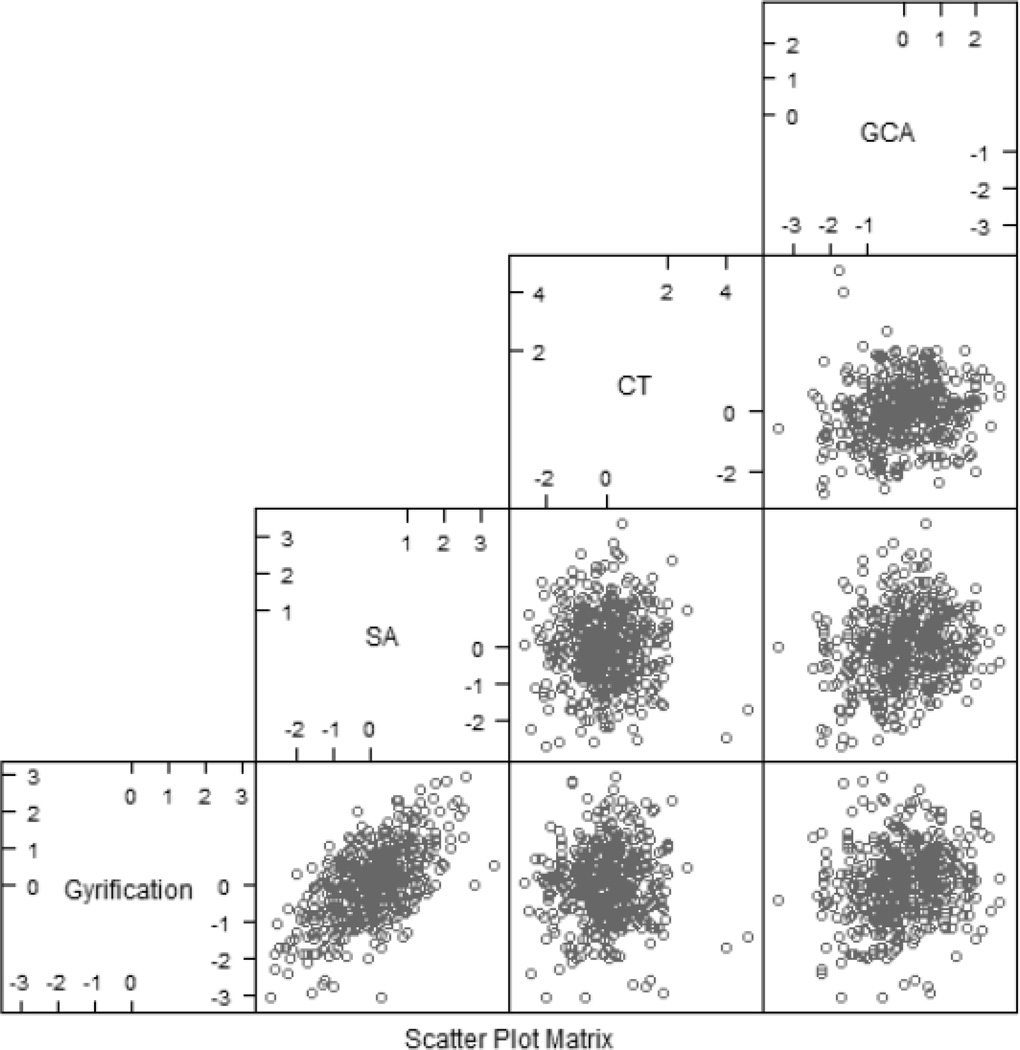
Figure 2.
Scatterplot matrix showing values of gyrification, SA, CT, and GCA plotted against one another. All variables have been z-scored and adjusted for age and scanner. Along the bottom row are plots of gyrification with SA, CT, and GCA. The row above depicts plots of SA against CT and GCA. Finally, the topmost graph depicts CT plotted against GCA.

