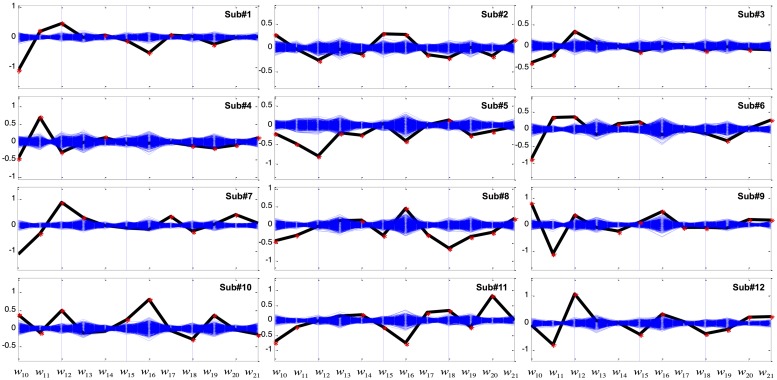
FIGURE 3.
Coefficients of the variables of the linear discriminant function in the Worse condition. The x-axis represents variables from X10 to X21 in Table 2 while the y-axis represents weight (w) value. The computed coefficients are depicted as black for the GVS discriminant function and blue for bootstrapping. Red asterisks denote coefficients that are outside the 95% confidence interval of bootstrapping.

