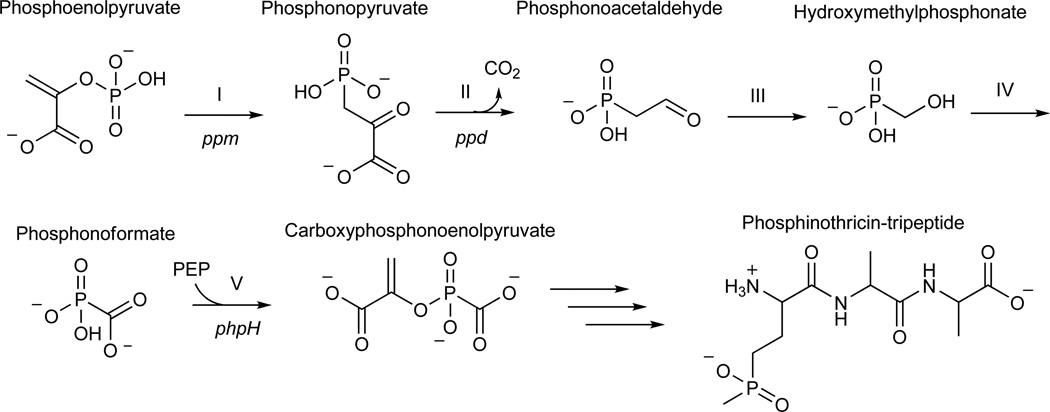
Figure 1.
Map of PTT biosynthetic genes and model for early steps in PTT biosynthesis. (a) Detail of genes in the core of the PTT biosynthetic gene cluster. Genes shown in grey were not studied in this work because they have experimentally established roles in PTT biosynthesis or because homology has allowed roles to be assigned by inference. The open reading frames in black did not have experimentally assigned roles, except for phpH, where this gene is expected to function in CPEP synthesis. (b) Model for carboxyphosphonoenolpyruvate biosynthesis from phosphonoacetaldehyde via the intermediates hydroxymethylphosphonate and phosphonoformate (adapted from3). Steps referred to in the text are denoted by roman numerals, and S. viridochromogenes genes thought to be involved in each step7 are indicated where possible.


