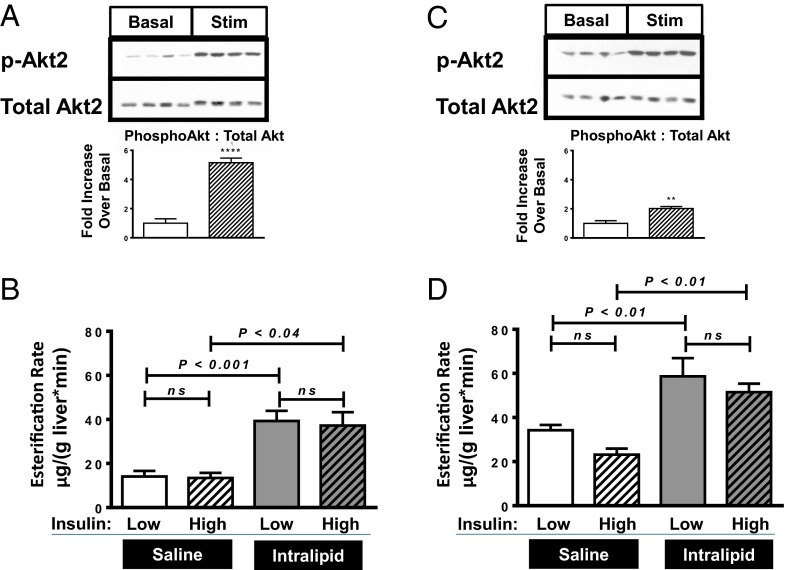
Fig. 1.
Infusion studies with insulin-sensitive regular chow-fed rats and insulin-resistant fat-fed rats. (A and B) Regular chow-fed rats. (C and D) Fat-fed rats. (A and C) Hepatic Akt2 phosphorylation immunoblots, comparing basal insulin infused (Basal) vs. high insulin infused (Stim) groups. Bar graphs represents quantitation of Western blot bands, ratio phosphorylated Akt2 to total Akt2, normalized to the basal group. (B and D) Esterification rates. Bar graph symbols—Western blot quantitation:  , basal group;
  , high insulin (Stim) group. **P < 0.01 and ****P < 0.0001 comparing insulin stimulated to basal. Esterification rates:
  , low insulin/saline infusion;
  , high insulin/saline infusion;
  , low insulin/Intralipid infusion;
  , high insulin/Intralipid infusion. Data reported as mean ± SEM.

