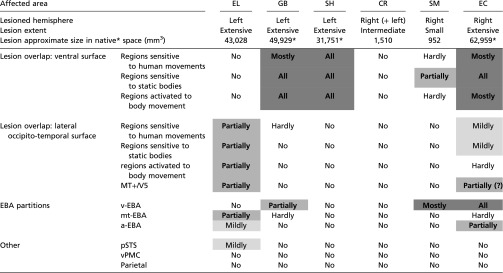
Table 3.
Summary of patients’ lesions
 |
The lesion size is based on the results of the lesion delineating procedure (see also Supporting Information). Because of the low spatial coverage of GB’s, SH’s, and EC’s clinical scans, their lesion size reflects a spatial interpolation across the lesion locations in the clinical images that were available. The assessment of the overlap of the lesion with regions associated with biological motion processing is predominantly based on a recent meta-analysis (13) (see text for details), as demonstrated in Fig. 3. Overlap with MT+/V5 is based on SM’s functional localization, and on MT+/V5 reported location for the other patients (81) (Methods). Overlap scale relates to foci reported in the meta-analysis with z ≥ 3.2 score (equivalent to P ≤ 0.0005). Overlap notations: No, none; Hardly, ∼ <10%; Mildly, ∼10–20%; Partially, ∼20–60%; Mostly, >60–70%; All, 100%. Regions that are significantly damaged are indicated in bold and shaded gray according to the extent of damage (Mostly to All in dark gray, Partially in medium gray, and Mildly in light gray). EBA partitions: v-EBA, aspect of EBA ventral to MT/V5; mt-EBA, aspect of EBA overlapping MT/V5; a-EBA, aspect of EBA anterior to MT/V5 (46, 47).
GB’s, CR’s, and EC’s lesion sizes were approximated on an MNI template brain and therefore provided in MNI normalized space units (mm3), which might be an overestimation relative to native space volume (82).
