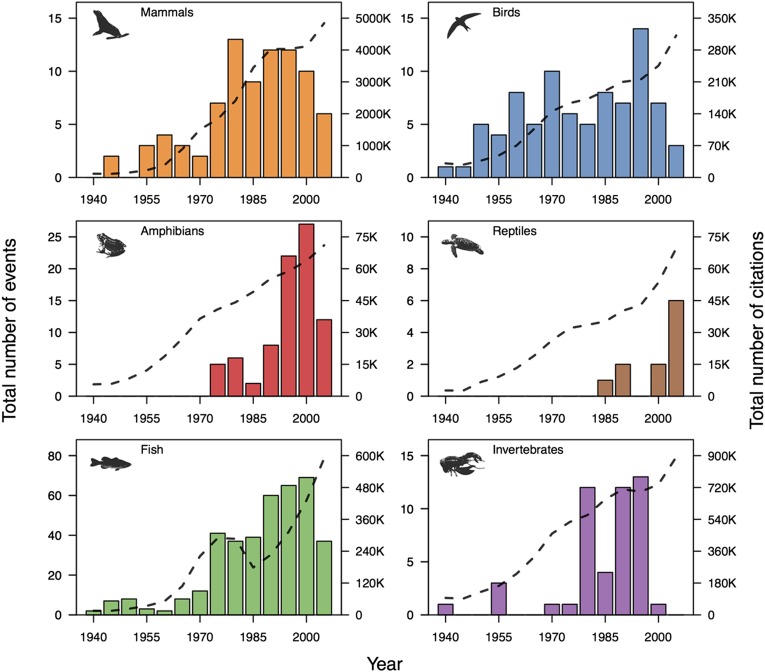
Fig. 1.
Occurrences of animal MMEs and taxon-specific publication trends through time. Colored bars indicate the number of events during a 5-y interval (e.g., 1940 stands for the 1940–1944 period), and dashed lines show trends in the total number of papers published each year for each taxon. For all taxa, the increase in the number of MMEs is coincident with an increase in the number of publications (SI Appendix, Fig. S1).

