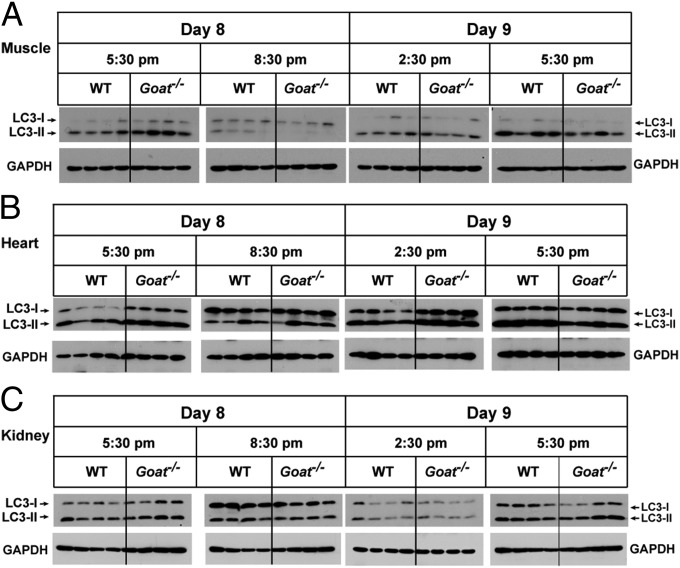
Fig. 2.
LC3 levels in muscle (A), heart (B), and kidney (C) before and after feeding in calorie-restricted WT and Goat−/− mice. The mice used in this experiment are the same as those used in the experiment shown in Fig. 1. Tissues were processed as described in Materials and Methods, after which 20 µg of each supernatant was subjected to immunoblot analysis with the indicated antibody.

