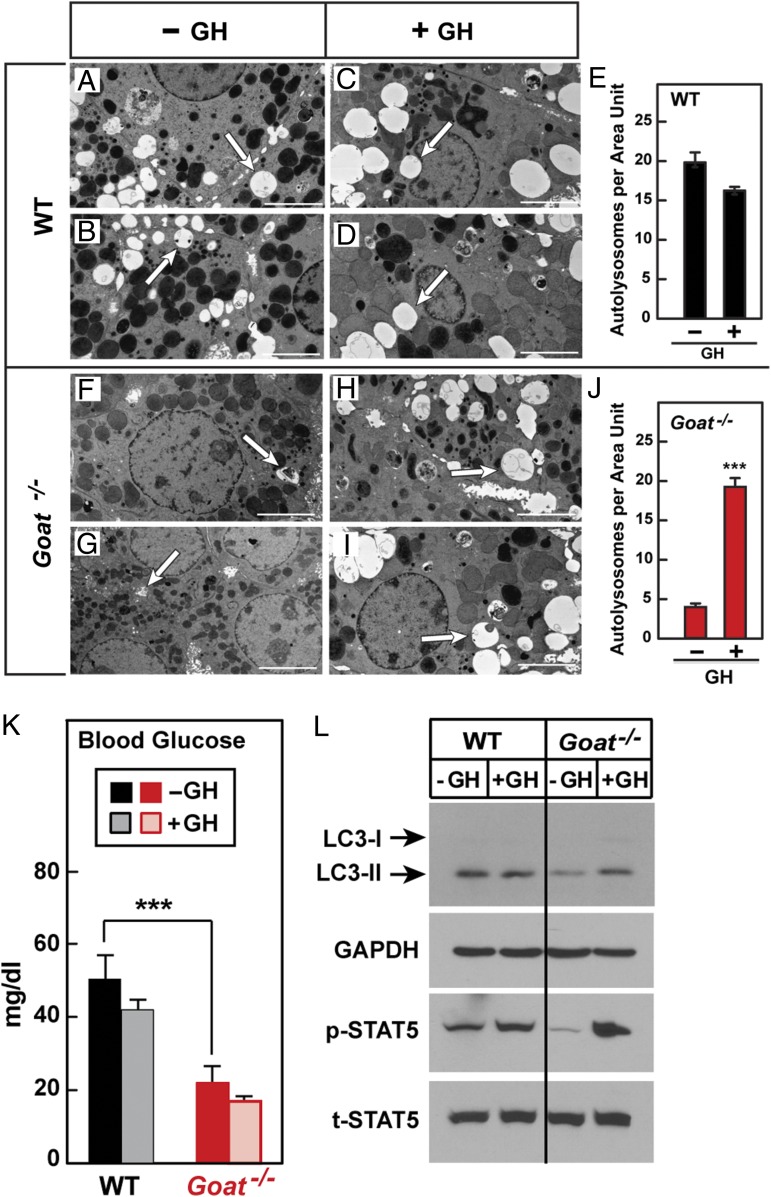
Fig. 5.
(A–J) Electron micrographs of livers from GH-injected, calorie-restricted WT (A–D) and Goat−/− (F–I) mice. Male WT and Goat−/− mice littermates (8 wk old) were subjected to 60% calorie restriction for 8 d. On day 7, each mouse received three s.c. injections of either vehicle or GH (30 µg per mouse) at 2:30 PM, 3:30 PM, and 4:30 PM. At 5:30 PM, blood was obtained for glucose measurements, after which mouse livers were fixed, perfused, and processed as described in Materials and Methods. Pictures from 20 different unit areas (36 × 26 µm per unit area) from two WT and two Goat−/− mice were taken at 5,000 amplitude; representative pictures are shown. White arrows denote typical autolysosomes. (Scale bar: 5 µm; magnification, 5,000×.) (E and J) The number of autolysosomes per unit area was determined by three independent examiners as described in Materials and Methods. Each value represents mean ± SEM of data from 20 images. Asterisks denote level of statistical significance (Student t test) between autolysosome numbers of vehicle or GH-injected WT (E) and Goat−/− (J) mice: ***P < 0.001. (K and L) Failure of acute injections of GH to restore blood glucose in Goat−/− mice. WT and Goat−/− mice (five in each group) were calorie-restricted and treated with three s.c. injections of GH as described above. On day 7, mice were killed at 5:30 PM, at 1 h after i.p. injection of leupeptin (15 mg/kg). Blood was obtained from the retro-orbital sinus for measurement of glucose (K). Supernatants from pooled livers of five mice were immunoblotted for LC3, GAPDH, p-STAT5, and t-STAT5 (L) as described in Fig. 1.

